
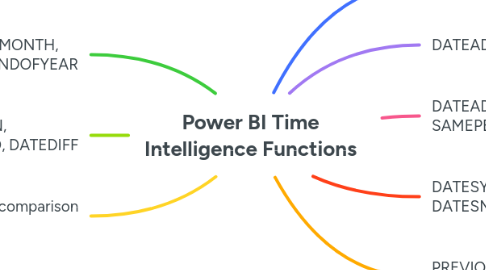
1. OPENINGBALANCEMONTH, STARTOFMONTH, ENDOFYEAR
1.1. These functions have more limited use cases. The course instructor suggested maybe inventory stock counts, but I suppose account balances would be another obvious use case.
1.1.1. I don't have good example data to show off these functions but we can use a simple sales count to illustrate how each works.
1.1.1.1. Here is a table with all 3 functions used in measures, calculated in 'Dates'[Date] context, alongside a simple sales count measure.
1.1.1.1.1. Opening Balance for Month = OPENINGBALANCEMONTH( [Total Count], 'Dates'[Date] )
1.1.1.1.2. Start of Month = CALCULATE( [Total Count], STARTOFMONTH( 'Dates'[Date] ) )
1.1.1.1.3. End of Year = CALCULATE( [Total Count], ENDOFYEAR( 'Dates'[Date] ) )
2. DATESBETWEEN, DATESINPERIOD, DATEDIFF
2.1. DATESBETWEEN and DATESINPERIOD can be used to achieve the same result. They share in common this idea of opening up a custom date window.
2.1.1. Here we can see a table visual with the two functions used to achieve the same calculation
2.1.1.1. Here are the two measure definitions:
2.1.1.1.1. Rolling Total DATESBETWEEN = CALCULATE( [Total Sales], DATESBETWEEN( 'Dates'[Date], MAX( 'Dates'[Date] ) - 30, MAX( 'Dates'[Date] ) ) )
2.1.1.1.2. Rolling Total DATESINPERIOD = CALCULATE( [Total Sales], DATESINPERIOD( 'Dates'[Date], MAX( 'Dates'[Date] ), -30, DAY ) )
2.1.1.2. When we visualise the measures in a line chart, we see even more clearly that they produce the same result
2.2. DATESINPERIOD is also well suited for calculating rolling averages
2.2.1. Moving Average 30 Days = AVERAGEX( DATESINPERIOD( 'Dates'[Date], MAX( 'Dates'[Date] ), -30, DAY ), [Total Sales] )
2.2.1.1. Here we see the rolling 30 day [Total Sales] average as a line against backdrop of [Total Sales] as clustered columns
2.3. DATEDIFF is useful in any scenario where you need to calculate a difference in some time unit between a couple of different date columns
2.3.1. For example, we might want to analyse the difference between sales order dates and ship dates
2.3.1.1. Days From Order To Ship = DATEDIFF( MIN( 'Sales'[OrderDate] ), MAX( 'Sales'[Ship Date] ), DAY )
3. Cumulative Sales time comparison example
3.1. Here we show sales alongside last quarter and 2 quarters ago, and equivalent cumulative sales. The area chart for cumulative sales helps compare adjacent quarter performance.
3.1.1. Sales Last Quarter = CALCULATE( [Total Sales], DATEADD( Dates[Date], -1, QUARTER ) )
3.1.2. Sales 2 Quarters Ago = CALCULATE( [Total Sales], DATEADD( Dates[Date], -2, QUARTER ) )
3.1.3. Cumulative Sales = CALCULATE( [Total Sales], FILTER( ALLSELECTED( 'Dates' ), 'Dates'[Date] <= MAX( 'Dates'[Date] ) ) )
3.1.4. Cumulative Sales LQ = CALCULATE( [Sales Last Quarter], FILTER( ALLSELECTED( 'Dates' ), 'Dates'[Date] <= MAX( 'Dates'[Date] ) ) )
3.1.5. Cumulative Sales 2Qs Ago = CALCULATE( [Sales 2 Quarters Ago], FILTER( ALLSELECTED( 'Dates' ), 'Dates'[Date] <= MAX( 'Dates'[Date] ) ) )
4. Importance of Date table
4.1. All the DAX time intelligence functions are designed to work from the Date table
4.2. Time intelligence functions will not work properly against date columns in your fact tables
5. DATEADD
5.1. We can easily get previous and next period measures using DATEADD
5.1.1. Here is an example table visual with some simple time intelligence functions based on DATEADD
5.1.1.1. Sales Last Year = CALCULATE( [Total Sales], DATEADD( Dates[Date], -1, YEAR ) )
5.1.1.2. Sales Last Month = CALCULATE( [Total Sales], DATEADD( Dates[Date], -1, MONTH ) )
5.1.1.3. Sales Next Month = CALCULATE( [Total Sales], DATEADD( Dates[Date], 1, MONTH ) )
5.1.1.4. For Day-over-Day (DoD) Growth, we can either use measure branching or variables to simplify
5.1.1.4.1. Measure branching approach:
5.1.1.4.2. Variables approach:
6. DATEADD vs SAMEPERIODLASTYEAR
6.1. Essentially, you don't need SAMEPERIODLASTYEAR, as the same result can easily be achieved using DATEADD
6.1.1. We see both measures produce the same values
6.1.1.1. Sales Last Year = CALCULATE( [Total Sales], DATEADD( 'Dates'[Date], -1, YEAR ) )
6.1.1.2. Sales Last Year 2 = CALCULATE( [Total Sales], SAMEPERIODLASTYEAR( 'Dates'[Date] ) )
7. DATESYTD, DATESQTD and DATESMTD
7.1. These functions are useful for cumulative totals by calendar year to date, quarter to date and month to date
7.1.1. Here we see YTD, QTD and MTD amounts in a table and line chart
7.1.1.1. Sales YTD = CALCULATE( [Total Sales], DATESYTD( 'Dates'[Date] ) )
7.1.1.2. Sales QTD = CALCULATE( [Total Sales], DATESQTD( 'Dates'[Date] ) )
7.1.1.3. Sales MTD = CALCULATE( [Total Sales], DATESMTD( 'Dates'[Date] ) )
7.1.2. We can also use the TOTALYTD, TOTALQTD and T OTALMTD functions to achieve the same thing but t hese have CALCULATE implicitly built into them and the course instructor advocates using DATESYTD, DATESQTD and DATESMTD with CALCULATE as a means to stay consistent across all measure definitions with the explicit use of CALCULATE
8. PREVIOUSMONTH and PARALLELPERIOD
8.1. PREVIOUSMONTH works like DATEADD only when the calculation context is year+month, otherwise the results are different
8.1.1. We can see this in two table visuals side by side
8.1.1.1. Sales Last Month = CALCULATE( [Total Sales], DATEADD( 'Dates'[Date], -1, MONTH ) )
8.1.1.1.1. We see this in the first table where the calculate context is 'Dates'[Date]. It calculates the sales for that date one month ago.
8.1.1.2. Sales Previous Month = CALCULATE( [Total Sales], PREVIOUSMONTH( 'Dates'[Date] ) )
8.1.1.2.1. We see this in both tables. In the first table, where the calculation is done in the 'Dates'[Date] context, it returns the total sales for ***every* ** date in the previous month, repeating that total across multiple rows. In the second table, where the calculation is in in the 'Dates'[Month & Year] context, it returns the same results that would be returned by DATEADD in the same context.
8.2. PARALLELPERIOD can do everything we get with PREVIOUSMONTH, PREVIOUSQUARTER and PREVIOUSYEAR but provides greater flexibility
8.2.1. Note: for PREVIOUSDAY we can just use DATEADD as the more flexible alternative
8.2.2. Let's add a measure for calculating the previous quarter's total sales
8.2.2.1. Here we see [Sales Last Quarter] in both the 'Dates'[Date] context and the 'Dates'[Month & Year] context
8.2.2.1.1. Sales Last Quarter = CALCULATE( [Total Sales], PARALLELPERIOD( 'Dates'[Date], -1, QUARTER ) )