Unlock the full potential of your projects.
Try MeisterTask for free.
¿No tienes una cuenta?
Regístrate Gratis
Navegar
Mapas Destacados
Categorías
Gestión de proyectos
Objetivos de negocio
Recursos humanos
Lluvia de ideas y análisis
Marketing y contenido
Educación y notas
Entretenimento
Vida
Tecnología
Diseño
Resúmenes
Otros
Idiomas
English
Deutsch
Français
Español
Português
Nederlands
Dansk
Русский
日本語
Italiano
简体中文
한국어
Otros
Ver mapa completo
Copiar y editar mapa
Copiar
Data Representation (by Group A1)
Otros
SK
S_h_a_r_o_n Khoo
Seguir
Comienza Ya.
Es Gratis
Regístrate con Google
ó
regístrate
con tu dirección de correo electrónico
Mapas Mentales Similares
Esbozo del Mapa Mental
Data Representation (by Group A1)
por
S_h_a_r_o_n Khoo
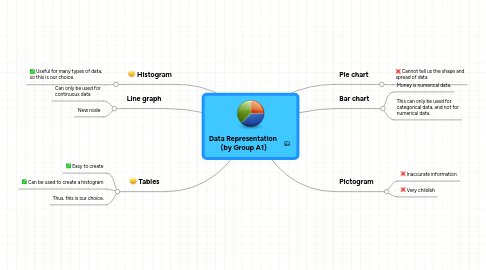
1. Histogram
1.1. Useful for many types of data, so this is our choice.
2. Tables
2.1. Easy to create
2.2. Can be used to create a histogram
2.3. Thus, this is our choice.
3. Line graph
3.1. Can only be used for continuous data
3.2. New node
4. Pie chart
4.1. Cannot tell us the shape and spread of data
5. Pictogram
5.1. Inaccurate information
5.2. Very childish
6. Bar chart
6.1. Money is numerical data.
6.2. This can only be used for categorical data, and not for numerical data.
Comienza Ya. ¡Es Gratis!
Conéctate con Google
ó
Regístrate