
PW3 ...Displaying data
por Helen fallon
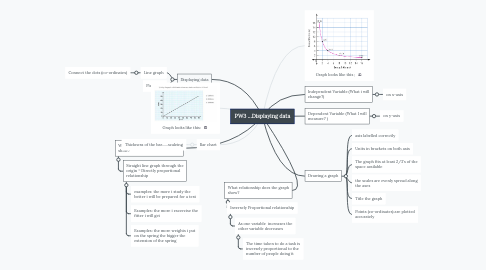
1. Displaying data
1.1. Line graph
1.1.1. Connect the dots (co-ordinates)
1.2. Pie-chart
2. What relationship does the graph show?
2.1. Inversely Proportional relationship
2.1.1. As one variable increases the other variable decreases
2.1.1.1. The time taken to do a task is inversely proportional to the number of people doing it
3. What Relationship does the graph show?
3.1. Straight line graph through the origin = Directly proportional relationship
3.1.1. examples: the more i study the better i will be prepared for a test
3.1.2. Examples: the more i excercise the fitter i will get
3.1.3. Examples: the more weights i put on the spring the bigger the extension of the spring