
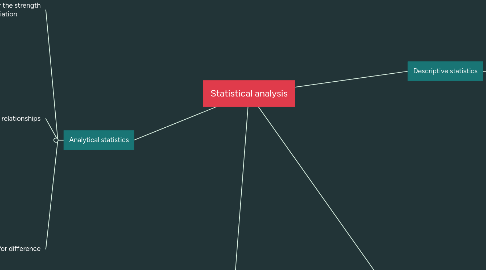
1. Analytical statistics
1.1. Tests for the strength of association
1.1.1. correlation analysis
1.1.1.1. linear regression/multiple linear regression for causation
1.1.1.2. Pearson correlation co-efficient (**parametric**)
1.1.1.3. Spearman's Rank Correlation (**non-parametric** )
1.1.1.4. Kendall's Rank correlation (also known as Kendall's Tau) (**non-parametric** )
1.2. Tests for relationships
1.2.1. sample more than 40
1.2.1.1. Chi-square test
1.2.1.1.1. Logistic regression for causation
1.2.1.1.2. Odds ratio 2x2 table
1.2.2. sample less than 40
1.2.2.1. Fisher's exact test
1.2.3. Odds ratio and relative risk can be used if comparing dichotomous data with dichotomous data (2x2 table)
1.3. Tests for difference
1.3.1. if quantitative data are normally distributed, use **parametric** statistics
1.3.1.1. 2 groups only (male and female)
1.3.1.1.1. Student T test
1.3.1.2. more than 2 groups
1.3.1.2.1. ANOVA test
1.3.2. if quantitative is skewed, use **non-parametric** statistics
1.3.2.1. 2 groups only (male and female)
1.3.2.1.1. Mann-Whitney U test
1.3.2.1.2. Wilxocon Rank Sum
1.3.2.1.3. Kendall's S-test
1.3.2.2. more than 2 groups
1.3.2.2.1. Kruskal-Wallis test
2. Descriptive statistics
2.1. Describe with numbers
2.1.1. numerical
2.1.1.1. continuous
2.1.1.2. discrete
2.1.2. catergorical
2.1.2.1. categorical (nominal)
2.1.2.1.1. dichotomous
2.1.2.2. ordinal
2.1.3. measures
2.1.3.1. central tendency
2.1.3.1.1. skewed data
2.1.3.1.2. normal distribution
2.1.3.2. spread
2.1.3.2.1. for normal distribution
2.1.3.2.2. for skewed data
3. Data visualisation/checking
3.1. graphs
3.1.1. Continuous
3.1.1.1. histogram, stem-leaf, box plot
3.1.2. Categorical
3.1.2.1. bar chart, pie chart
3.1.3. Two continuous variables
3.1.3.1. Scatter plot