
1. Near term trading range
2. For Detailed Information Visit http://followthebots.com/market-structure
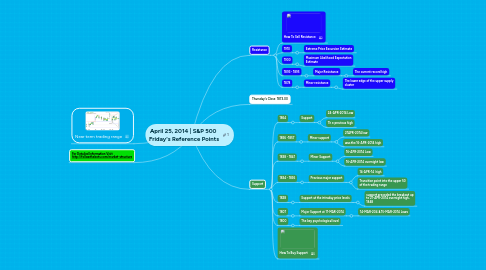
3. Resistance
3.1. How To Sell Resistance
3.2. 1910
3.2.1. Extreme Price Excursion Estimate
3.3. 1900
3.3.1. Maximum Likelihood Expectation Estimate
3.4. 1893 - 1895
3.4.1. Major Resistance
3.4.1.1. The current record high
3.5. 1878
3.5.1. Minor resistance
3.5.1.1. The lower edge of the upper supply cluster
4. Thursday's Close 1873.00
5. Support
5.1. 1864
5.1.1. Support
5.1.1.1. 24-APR-2014 Low
5.1.1.2. Th e previous high
5.2. 1856 -1857
5.2.1. Minor support
5.2.1.1. 21APR-2014 low
5.2.1.2. was the 16-APR-2014 high
5.3. 1838 - 1841
5.3.1. Minor Support
5.3.1.1. 16-APR-2014 Low
5.3.1.2. 16-APR-2014 overnight low
5.4. 1834 - 1836
5.4.1. Previous major support
5.4.1.1. 14-APR-14 high
5.4.1.2. Transition point into the upper 50 of the trading range
5.5. 1828
5.5.1. Support at the intraday price levels
5.5.1.1. support preceded the breakout up to 21-APR-2014 overnight high, 1848
5.6. 1807
5.6.1. Major Support at 11-MAR-2014
5.6.1.1. 14-MAR-204 & 15-MAR-2014 Lows
5.7. 1800
5.7.1. The key psychological level