

1. Rising sea level
1.1. Sea Levels has been rising over the past century, and the rate has increased in recent decades. In 2014, global sea level was 2.6 inches above the 1993 average—the highest annual average in the satellite record (1993-present). Sea level continues to rise at a rate of about one-eighth of an inch per year. Sea levels are thought to increase 4
1.1.1. Disruptive and expensive, nuisance flooding is estimated to be from 300 percent to 900 percent more frequent within U.S. coastal communities than it was just 50 years ago.5
1.2. sea level has risen at an estimated rate of 1.8 mm (.07 inches) per year in the last 50 years but in the last 12 years that rate appears to be 3 mm (.12 inches) per year. expansion of ocean water as it has increased in temperature, with the rest coming from other sources". 4
1.2.1. nasa has been recording the height of the sea level and ocean surface (satellite data) since 1992 through space borne altimeters, Nasa has been making continuous measurements ever since. they have recorded about 7.4 cm of sea level rises averaged over the globe. 6
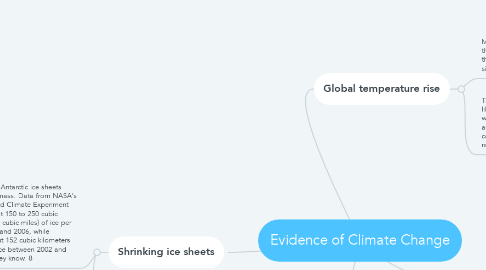
2. Global temperature rise
2.1. Most of the warming that has occurred in the past 35 years, has resulted with 16 of the 17 warmest years on record occurring since 2001. 7
2.1.1. 2016 the warmest year on record, from January through September, with the exception of June — were the warmest on record for those respective months. Nasa uses credible data sets located in the us to study global temperature. 7
2.2. The current warming trend shows the likelihood (95 percent probability) that warming has occured as a result of human activity since mid 20th century and continues to proceed at an unpredictable rate over a millenia. 7
2.2.1. The planet's average surface temperature has risen about 2.0 degrees Fahrenheit (1.1 degrees Celsius) since the late 19th century, a change driven largely by increased carbon dioxide and other human-made emissions into the atmosphere. --> satellite data. 7
3. Shrinking ice sheets
3.1. The Greenland and Antarctic ice sheets have decreased in mass. Data from NASA's Gravity Recovery and Climate Experiment show Greenland lost 150 to 250 cubic kilometers (36 to 60 cubic miles) of ice per year between 2002 and 2006, while Antarctica lost about 152 cubic kilometers (36 cubic miles) of ice between 2002 and 2005.--> how do they know. 8
3.1.1. NASA has been recording the height of the ocean surface from space since 1992. That year, NASA and the French space agency, CNES, launched the first of a series of spaceborne altimeters that have been making continuous measurements ever since. The first instrument, Topex/Poseidon, and its successors, Jason-1 and -2, have recorded about 2.9 inches (7.4 centimeters) of rise in sea level averaged over the globe. 8