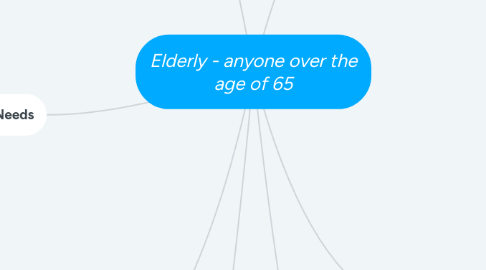
1. Mineral Needs
1.1. Calcium
1.1.1. Hydrochlorhydria - low stomach acid creates a failure to effectively absorb calcium
1.1.2. Increase need in diet
1.2. Iron
1.2.1. Stores increase w/ age
1.2.2. Iron deficiency
1.2.2.1. GI blood loss
1.2.2.2. Peptic acid
1.2.2.3. NSAIDS
1.3. Zinc
1.3.1. Intake declines as caloric intake declines
1.3.2. Symptoms of Deficiency:
1.3.2.1. Impaired immune system
1.3.2.2. Anorexia
1.3.2.3. Dysgeusia
1.3.2.4. Delayed wound healing
1.3.2.5. Bed sores
1.4. Sodium
1.4.1. Healthy Individuals DRI: 2,300 mg
1.4.2. Over age 50 and/or Hypertensive: > 1,500 mg (difference of 800 mg)
2. Vitamin Needs
2.1. Vitamin D
2.1.1. Poor dietary intake
2.1.2. Reduced sun exposure
2.1.3. Impaired conversion of precursors
2.2. Antioxidant vitamins protect against macular degeneration and cataracts
2.2.1. Carotenoid
2.2.2. Vitamin C
2.2.3. Vitamin E
2.3. Vitamin B6
2.3.1. Inadequate intake
2.3.2. Atrophic gastritis interferes w/ absorption
2.3.3. Alcoholism
2.4. Vitamin B12
2.4.1. Atrophic gastritis
2.4.2. Bacterial growth
3. Fluid Needs
3.1. Reduced thirst sensation
3.2. Reduce fluid intake
3.3. Limited access to water
3.4. Decreased water conservation by the kidneys
3.5. Recommendations: 30-35 ml/kg of body weight
4. Malnutrition Causes
4.1. Depression
4.2. Polypharmacy
4.2.1. Drugs can change food intakes and nutrient absorption
4.2.1.1. Drugs can change nutrient excretion
4.2.2. Food can change drug absorption and metabolism
4.2.2.1. Food can change drug excretion
4.2.3. Prescription Drugs
4.2.3.1. Important to consider length of taking medication
4.2.3.2. If taking more than 1 medication at a time
4.2.3.3. Nutrient status prior to medication
4.2.4. Over-the-Counter Drugs
4.2.4.1. Aspirin
4.2.4.2. Antacids
4.2.4.3. Laxatives
4.2.4.4. Supplements
4.3. Decreased or loss of income
4.4. Isolation/lost of loved ones
4.5. Diseases
4.6. Limited nutrition knowledge
4.7. Dental problems
4.8. Dementia
4.9. Decreased functionality
4.9.1. Adaptive Feeding Equipment
4.9.1.1. Sure Grip
4.9.1.2. Weight Utensils
4.9.1.3. Rocking Knife
4.9.1.4. Soft-Coated Spoons
4.9.1.5. Plastic Handled Swivel Utensils
4.9.1.6. Sure Hand Strap
4.9.1.7. Dysphagia Cups
4.9.1.8. 2-Handed Nosey Cups
4.9.1.9. Clip-On Food Guard
4.9.1.10. Scooper Plate
4.9.1.11. Partitioned Scoop Dish
4.10. Substance abuse
4.11. Dysphagia
5. Impact of Aging
5.1. Senses diminish
5.2. Issues w/ oral health
5.2.1. Xerostomia
5.2.2. Peridontitis (gum disease)
5.3. Issues w/ GI function
5.3.1. Produce less lactase
5.3.2. Atrophic gastritis
5.3.3. Decreased intestinal muscle strength
5.3.3.1. Deficient fluid intake
5.3.3.2. Inadequate fiber intake
5.3.3.3. Sedentary lifestyle
5.3.3.4. Inadequate energy intake
5.3.3.5. Psychological stress
5.4. Metabolic Function
5.4.1. Decreased glucose tolerance
5.4.2. RMR decreases
5.5. Cardiovascular
5.5.1. Blood vessels become less elastic
5.6. Renal Function
5.6.1. Decreased function and glomerular filtration rate
6. Energy Requirements
6.1. Calorie Needs
6.1.1. Normal Weight: 25 cal/kg of body weight
6.1.2. Underweight/Bed Sores: 30-35 cal/kg of body weight
6.1.3. Extremely Underweight/Bed Sores: 40 cal/kg of body weight
6.2. Protein Needs
6.2.1. Increase in age because there is a decrease in skeletal tissue mass
6.2.2. 1 g/kg of body weight - needed for maintaining + nitrogen balance
6.2.3. Sermin albumin levels is an indicator of protein levels
6.3. CHO Needs
6.3.1. 50-60% total calories
6.3.2. Emphasis of complex carbs and dietary fiber
6.3.3. Limit intake of simple sugars - cannot readily break them down
6.4. Dietary Lipids
6.4.1. Recommendations are based on weight control and cancer prevention
6.4.2. Restricting lipids to less than 20% of total calories may affect overall diet quality
7. Assessing Weight Status & Changes
7.1. Percent of Usual Body Weight
7.1.1. 85-90% = mildly malnourished
7.1.2. 75-84% = moderately malnourished
7.1.3. > 74% = severely malnourished
7.1.4. 48-55% = minimum weight for survival
7.2. Unintended weight loss may be a symptom of malnutrition
7.2.1. 5% in 1 month
7.2.2. 7.5% in 3 months
7.2.3. 10% in 6 months

