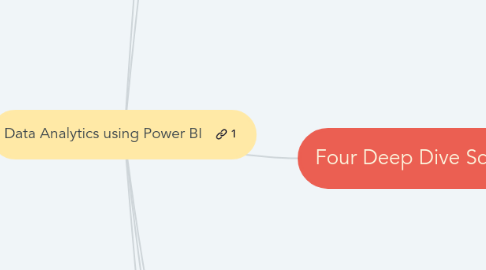
1. Starting Points
1.1. Recap Course Objectives
1.2. Access this Mindmap
1.2.1. Copy this Mindmap
1.3. Download Course Datasets
1.3.1. Download Course Materials
1.4. Download Power BI Desktop
1.4.1. Create a Power BI Online Account
2. Fundamentals
2.1. Purpose of Power BI
2.1.1. Weekdone: OKR Examples
2.2. Anatomy of Power BI
2.2.1. Microsoft: PBI Desktop and PBI Service
2.2.2. SQL Dusty: Power BI Architecture
2.3. Introduction to Power BI Desktop
2.3.1. Microsoft: PBI Desktop
2.3.2. TDS: Forecasting in Power BI
2.4. Introduction to Power BI Online
2.4.1. Microsoft: PBI Service
2.4.2. Microsoft: Share in Power BI
2.4.3. Microsoft: Data Refresh in Power BI
2.5. Process of Power BI
2.5.1. Roman Pilcher: Product Management
2.5.2. Map and Fire: Jobs to be Done
3. Four Deep Dive Scenarios
3.1. 1. Visual Analytics
3.1.1. Visual Analytics
3.1.1.1. Tibco: What is Data Science?
3.1.1.2. McKinsey: Analytics Disciplines
3.1.1.3. Info is Beautiful: Information Design
3.1.1.4. UX Planet: Better Dashboard Design
3.1.1.5. Tufte: Graphical Excellence
3.1.1.6. Few: Why Most Dashboards Fail
3.1.1.7. PLOS: 10 Simple Rules for Better Charts
3.1.2. Visual Analytics Scenario
3.1.2.1. YouTube: Hans Rosling
3.1.2.2. Gapminder: The Gapminder Visual
3.2. 2. Dashboard Mechanics
3.2.1. Dashboard Mechanics
3.2.1.1. Juice: A Guide to Creating Dashboards People Love to Use
3.2.1.2. Few: Why Most Dashboards Fail
3.2.1.3. Weekdone: OKRs
3.2.2. Dashboard Mechanics Scenario
3.2.2.1. Microsoft: Cards
3.2.2.2. Microsoft: Slicers
3.2.2.3. Microsoft: Bookmarks
3.3. 3. Data Wrangling
3.3.1. Data Wrangling
3.3.1.1. LearnSQL: Power BI Capabilities
3.3.1.2. Microsoft: Database Design Basics
3.3.1.3. Microsoft: Understand Star Schema
3.3.2. Data Wranging Scenario (pt.1)
3.3.2.1. Microsoft: M Query Language
3.3.2.2. Microsoft: Power Query Editor
3.3.2.3. ExceleratorBI: Data Design in Power BI
3.3.2.4. Global Innovation Index
3.3.3. Data Wrangling Scenario (pt.2)
3.3.3.1. Microsoft: Models in Power BI Desktop
3.3.3.2. Microsoft: Row Level Security
3.4. 4. Calculated Measures
3.4.1. Calculated Measures
3.4.1.1. Microsoft: DAX Guide
3.4.1.2. DAX Patterns: Pattern Book
3.4.1.3. Energy Central: Analytics Curve
3.4.1.4. Microsoft: DAX Quickstart
3.4.2. Calculated Measures Scenario
3.4.2.1. An Advanced DAX Pattern
3.4.2.1.1. XXLBI: Regression in DAX
3.4.2.2. SQLBI: Row and Filter Context
4. Prototyping vs. Production
4.1. Power BI in Pipelines
4.1.1. Microsoft: Big Data Architectures
4.1.2. Microsoft: Enterprise Data Warehouse
4.1.3. Learnen: Excel Online To Power BI
4.1.4. Microsoft: Enterprise Business Intelligence
5. Final Exercise
5.1. A "What If" Dashboard
5.1.1. EnterpriseDNA: Scenario Analysis in PBI
5.1.2. Microsoft: Data Refresh in Power BI
