

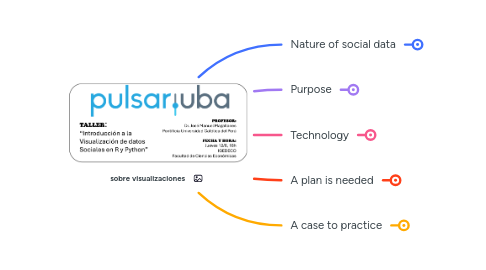
1. Nature of social data
1.1. incomplete
1.2. messy
1.3. Biased by Collector/Decision-Maker
1.4. Faces Competing Frameworks
1.5. Dynamic and Evolving
1.6. Context-Dependent
1.7. Non-Linear and Interconnected
1.8. Difficult to reverse engineer
2. Purpose
2.1. Reduce social complexity
2.1.1. limitations
2.1.1.1. financial reasons
2.1.1.2. political pressure
2.1.1.3. limited knowledge
2.1.1.3.1. simple is beautiful, especially with humans
2.1.1.4. institutional inercy
2.1.1.5. data available
2.1.1.5.1. How much data?
2.2. communicate with audience
2.2.1. guiding?
2.2.1.1. manipulating?
2.2.2. empowering?
3. Technology
3.1. we have more tools than ever
3.1.1. badColoring
3.1.2. badProportion
4. A plan is needed
4.1. documentation and curation
4.2. the situation
4.2.1. tells WHAT data to consider
4.3. the problem
4.3.1. tells WHICH data to CHOOSE
4.4. the methodology
4.4.1. basics of data
4.4.1.1. Types
4.4.1.1.1. Numeric
4.4.1.1.2. Categorical
4.4.1.1.3. Logical
4.4.1.1.4. String
4.4.1.1.5. Date
4.4.1.2. Structures
4.4.1.2.1. Table
4.4.1.2.2. Map
4.4.1.2.3. Graph
4.4.1.2.4. Text
4.4.2. not so creative but time consuming stage
4.4.2.1. collecting
4.4.2.2. cleaning
4.4.2.3. formatting
4.4.2.4. integrating
4.4.2.4.1. concatenating
4.4.2.4.2. merging
4.4.2.5. transforming
4.4.2.5.1. structure
4.4.2.5.2. values
4.4.3. yes.... statistics time or ML for uncover patterns
4.4.3.1. assume that there is stochasticity
4.4.3.1.1. infer/predict from these relationships
4.4.4. visualization comes
4.4.4.1. explore the variables
4.4.4.2. see model behavior (stats or ML)
4.4.4.3. show insights (interesting patterns)
4.5. The visualization at the final stage
4.5.1. visualization elements
4.5.1.1. Title
4.5.1.1.1. Main: "The title is the answer"
4.5.1.1.2. Sub: Just for the specifics (place, time, etc)
4.5.1.2. Axes
4.5.1.2.1. Includes Zero?
4.5.1.2.2. Units of measurement
4.5.1.2.3. annotations might make them irrelevant
4.5.1.3. Caption
4.5.1.3.1. Source: cite!
4.5.1.3.2. Some technical notes
4.5.1.4. Annotations
4.5.1.4.1. not for all values
4.5.1.4.2. a tool for focus
4.5.1.4.3. can be
4.5.1.5. Background
4.5.1.5.1. Grid
4.5.1.5.2. Margins
4.5.1.6. Legend
4.5.1.6.1. helps
4.5.1.6.2. not much help
4.5.2. visualization and the variables
4.5.2.1. encoding
4.5.2.1.1. color
4.5.2.1.2. shape
4.5.2.1.3. position
4.5.2.1.4. Length
4.5.2.1.5. Trend
4.5.2.1.6. Angles
4.5.2.1.7. Connections
4.5.2.1.8. count
4.5.2.1.9. proportion
4.5.2.1.10. others
5. A case to practice
5.1. the main source
5.1.1. from 2006-2023
5.1.1.1. each year in a separate excel
5.1.2. 12 indicators
5.1.2.1. cohesion
5.1.2.2. politics
5.1.2.3. economy
5.1.2.4. social
5.1.3. other sources
5.1.3.1. region information
5.1.3.2. geographical structure
5.2. codings
5.2.1. Python for PreProcessing
5.2.1.1. collect (download) and integrate (concatenate and merge)
5.2.1.2. compute indicators
5.2.1.2.1. univariate
5.2.1.2.2. bivariate
5.2.1.3. reduce dimensionality
5.2.1.3.1. add spatial attributes
5.2.2. R for Visualization
5.2.2.1. create and decide final plot
5.2.2.1.1. code
5.2.2.1.2. data
5.2.2.2. publish the plot (dashboard)
5.2.2.2.1. basic dashboard
5.2.2.2.2. dashboard-frames
5.2.2.2.3. dashboard-tabs
5.2.2.2.4. dashboard-pages