Unlock the full potential of your projects.
Try MeisterTask for free.
アカウント登録をしていませんか?
無料で登録する
ブラウズ
特定マップ
カテゴリー
ビジネス
デザイン
教育
エンターテインメント
ライフ
マーケティング
生産性
サマリー
テクノロジー
その他
言語
English
Deutsch
Français
Español
Português
Nederlands
Dansk
Русский
日本語
Italiano
简体中文
한국어
その他
フルマップを表示
マップをコピーして編集する
コピー
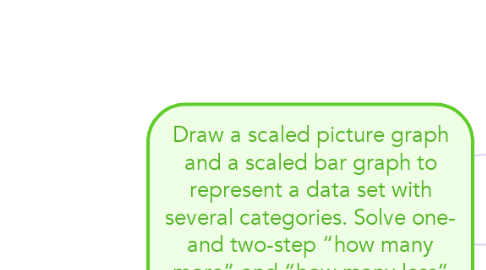
Draw a scaled picture graph and a scaled bar graph to represent a data set with several categorie...
その他
Casey Rae
フォローする
Solve your problems or get new ideas with basic brainstorming
登録は簡単!.
無料です
Google で登録
または
登録
あなたのEメールアドレスで登録
類似のマインドマップ
マインドマップの概要
Draw a scaled picture graph and a scaled bar graph to represent a data set with several categories. Solve one- and two-step “how many more” and “how many less” problems using information presented in scaled bar graphs.
Casey Rae
により
1. Interests
1.1. Mia
1.2. Daniel
2. Readiness Level
2.1. Anney
2.2. Haylie
3. Learning Profiles
3.1. Angelica
3.2. Joshua
さぁ、無料で始めましょう!
Googleとつなぐ
または
登録