
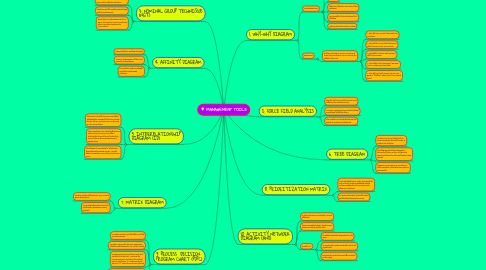
1. 3. NOMINAL GROUP TECHNIQUE (NGT)
1.1. issue / idea input from everyone on the team and for effective decisions
1.2. solving a specific problem to gathering project requirements.
1.3. When ideas are being generated by a group, the loudest or most passionate voices can often dominate the conversation.
2. 4. AFFINITY DIAGRAM
2.1. A group decision-making technique
2.2. To sort a large number of ideas into naturally related group.
2.3. For problem understanding & possible breakthrough solutions.
3. 5. INTERRELATIONSHIP DIAGRAM (ID)
3.1. The team to classify the cause-and-effect relationships among all the factors so that the key drivers and outcomes can be used to solve the problem.
3.2. The procedure is start with the first issue and evaluate the cause-and-effect relationship for each issues in the circle; arrow is drawn from stronger issue to weaker issue
3.3. The diagram is completed by tallying the incoming and outgoing arrows – usually highest outgoing arrows (driver) is the root cause
4. 7. MATRIX DIAGRAM
4.1. To show relationship between 2,3,4 or more group of members
4.2. To provide information about the relationship (examples: nature, strength
5. 9. PROCESS DECISION PROGRAM CHART (PDPC)
5.1. to avoids surprises and identifies possible countermeasures
5.2. Procedure starts with the team stating the objective and followed by the activity (level)
5.3. Countermeasures are brainstormed and placed in the last level – evaluate the countermeasures and select the optimal ones by placing an “O” underneath and place an “X” under those that are rejected
5.4. Used when the task is new or unique, complex or potential failure has great risks – mechanism to minimize uncertainty in an implementation plan
6. 1. WHY-WHY DIAGRAM
6.1. CHARATERISTICS
6.1.1. Focuses on process rather than on people.
6.1.2. Very simple
6.1.3. Effective to find the root cause of the problems.
6.1.4. Very beneficial in developing critical thinking.
6.1.5. Quick method of problem solving.
6.2. EXAMPLES
6.2.1. Problem Statement: You are on your way home from work and your car stops in the middle of the road.
6.2.1.1. 1. Why did your car stop? Because it ran out of gas.
6.2.1.2. 2. Why did it run out of gas? Because I didn’t buy gas on my way to work.
6.2.1.3. 3. Why didn’t you buy gas? Because I didn’t have money.
6.2.1.4. 4. Why didn’t you have money? Because I lost in a poker game last night.
6.2.1.5. 5. Why did you lose? Because I’m not very good at “bluffing” when I don’t have a good hand.
7. 2. FORCE FIELD ANALYSIS
7.1. Identify the forces and factors that may influence the problem or goal.
7.2. To better understand promoting/ driving/ restraining/ inhibiting forces
7.3. The positives can be reinforced and the negatives reduced or eliminated
8. 6. TREE DIAGRAM
8.1. to reduce any broad objective into increasing levels of detail in order to achieve the objective.
8.2. The diagram should be reviewed to determine if these actions will give the results anticipated or if something has been missed
8.3. Diagram encourages team members to think creatively and makes large projects manageable
9. 8. PRIORITIZATION MATRIX
9.1. Tools prioritize issues, tasks, characteristics and so forth, based on weighted criteria using a combination of tree and matrix diagram techniques
9.2. To reduce the team's rationally before detailed implementation occurs.
10. 10. ACTIVITY NETWORK DIAGRAM (AND)
10.1. It allows the team to schedule a project efficiently
10.2. shows completion times, simultaneous tasks and critical activity path
10.3. Benefits are:
10.3.1. A realistic timetable determined by the users
10.3.2. Team members understand their role in the overall plan
10.3.3. Bottlenecks can be discovered & corrective action taken