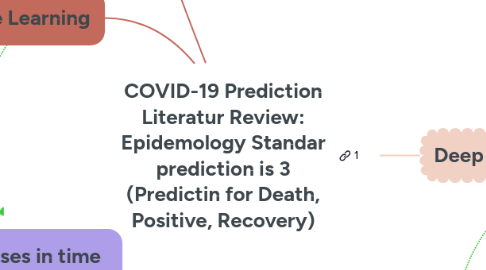
1. Machine Learning
1.1. Gaussian Naive Bayes (Schüttler et al.).
1.1.1. 1 features death. NO accuracy/performa measurement for death prediction
1.2. Gaussian Naive Bayes-Marcove Chain (Berihuete et al., 2021; Çelik, 2022).
1.2.1. 2 feature, Infected, population. NO accuracy/performa measurement for death prediction. CI 95%
1.3. Gaussian Naive - AdaBoost (Çelik, 2022).
1.3.1. 3 features, and clasification, 54% accuracy
1.4. MLP-ANN[Borghi et al., 2021)
1.4.1. 1 features, Death- Hight accuracy in training but less accuracy in testing. MAE 3,718 (10x)
1.5. MLP-Marcove Chain (Haghighat, 2021)
1.5.1. 2 features, Positive RMSE 5.729, Death RMSE 1.223, Overfitting
1.6. MLP-Cekoo Seach (Shetty & Pai, 2021))
1.6.1. 1 features, Positive MAPE 7.03%
2. weaknesses in time consuming and the output are unstable. Why the prediction still missing??
3. The features complexity of covid 19 data Non-linear, multivariable, and uncertain data creates problems in prediction accuracy
4. Epidemology Model
4.1. SIR (harma et al.,2021; Kartono et al., 2021; Foisal & Alam, 2023; Manrique-Abril et al., 2023; Megrous, 2023)
4.1.1. homogen, 3 features, accuracy only in early wave 2 days prediction, >90% accuracy has bias
4.2. SIRD (Sedaghat et al., 2020, Chatterjee et al., 2021; Shringi et al., 2021; McKeigue & Wood, 2022)
4.2.1. early prediction 70% but innacurate for long data durations less than >50%, 4 features.
4.3. ARIMA (J. Sun & Sun, 2021; Isra Al-Turaiki et al., 2021; Alabdulrazzaq et al., 2021, Zuhairoh & Sarasati, 2022; Maan et al., 2022; Capobianco, 2023; Hung & Lee, 2023; Abdelaziz, M., etc 2023)
4.3.1. 30 days MAPE 70.17%, 15 days MAPE 49.97% bias to handle multivariable dataset
5. SIR, SIRD, ARIMA prone to bias and has less accuracy - not accomodate all Covid-19 Features
6. the initial weight of the LSTM increased its susceptibility to variations in the input data, leading to less reliable and imprecise predictions
6.1. Feature Selection
6.2. Optimization Algorithm
6.2.1. PSO
6.2.2. GWO
7. Deep Learning Model
7.1. LSTM (Ghany et al., 2021)
7.1.1. RMSE Positive 1768.35,
7.2. LSTM (Iqbal et al., 2021)
7.2.1. 1 feature, 3 months, NO accuracy/performa measurement
7.3. BI-LSTM (Aung et al., 2023)
7.3.1. 24 features, standar scaler-feature enginering, MAPE 34%
7.4. LSTM vs Bi-LSTM vs ED-LSTM (Chandra et al., 2022)
7.4.1. 4 features, LSTM RMSE 1413, Bi_LSTM RSTME 1449, ED-LSTM, 1621
