1. Compare GDP of two groups of countries
1.1. Group of developed countries
1.1.1. Applying modern technology to boost the economy
1.1.2. Promote activities on industry - service groups
1.1.3. Human development index is high
1.1.4. foreign debt is low
1.1.5. Foreign Direct Investment is high
1.1.6. Quality of people's life is high
1.1.7. Service and education sectors develop strongly and sustainably
1.1.8. Italy - 2.085.839.128.509
1.1.9. Spain - 1.297.900.898.990
1.1.10. Singapore - 306.373.086.074
1.1.11. Finlands - 265.351.928.114
1.1.12. Qatar - 161.521.934.716
1.2. Group of developing countries
1.2.1. Service and education sectors develop at an average rate
1.2.2. The economy is still dependent on the ratio of industry - agriculture
1.2.3. The economic promotion of the economy of the prison' agricultural group
1.2.4. GDP per capita is low
1.2.5. Human Development Index is low
1.2.6. Foreign debt too much
1.2.7. Quality of people’s life is still average
1.2.8. Venezuala - 369.985.819.938
1.2.9. Angola - 81.802.995.486
1.2.10. Myanmar - 56.440.403.533
1.2.11. Laos - 13.194.357.287
1.2.12. Timor-leste - 1.404.040.653
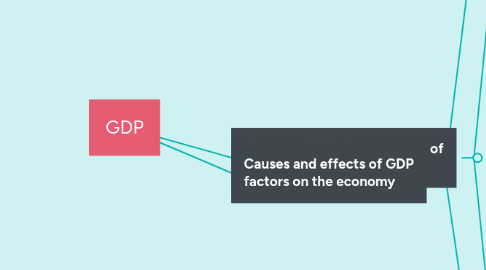
2. Causes and effects of GDP factors on the economy
2.1. Investment (I)
2.1.1. Reason
2.1.1.1. Important factors contributing to the economic situation
2.1.1.2. Create strong growth effects for industry groups
2.1.2. The impact
2.1.2.1. Affect output
2.1.2.1.1. In the short run: investment affects output through changes in aggregate demand
2.1.2.1.2. In the long run: change in supply capacity, increase potential output
2.1.2.2. Dominate the economic market
2.1.2.2.1. Enterprises maximize profits, revenue increases -> increase the amount of investment in the economy
2.1.2.2.2. Production output and consumption decrease -> reduce capital investment in the economy
2.2. Net Export (NX)
2.2.1. Reason
2.2.1.1. Main source of income
2.2.1.1.1. It promotes the socio-economic development of the nation
2.2.1.1.2. Reflecting the difference of import - export market
2.2.1.2. Shows a country's competitiveness in the international market
2.2.1.2.1. Reflects the supply and demand of money
2.2.1.2.2. Exchange rate change
2.2.2. The impact
2.2.2.1. Unbalanced trade balance
2.2.2.1.1. Imports are larger than exports
2.2.2.1.2. Can't control the export - import market
2.2.2.2. Factors that strongly affect a country's economy
2.2.2.2.1. If NX increases, FDI attraction will increase -> improve the country's position in the international market
2.2.2.2.2. If NX falls, trade deficit -> can’t meet domestic aggregate demand and other export standards
