PERT Chart

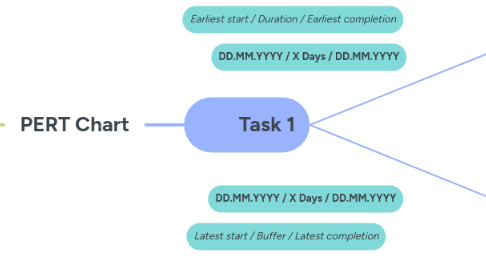
PERT stands for Program Evaluation Review Technique. A PERT diagram helps you to visualize and plan a complex project by calculating how long individual project tasks will take to complete. This allows you to better estimate the expected overall duration and costs of the project.

Kom i gang. Det er Gratis
eller tilmeld med din email adresse
PERT Chart af Mind Map: PERT Chart

1. Start Date: DD.MM.YYY

2. Earliest start / Duration / Earliest completion

3. Earliest start / Duration / Earliest completion

4. DD.MM.YYYY / X Days / DD.MM.YYYY

5. DD.MM.YYYY / X Days / DD.MM.YYYY

6. Task 4

7. Task 2

8. Earliest start / Duration / Earliest completion

9. Earliest start / Duration / Earliest completion

10. DD.MM.YYYY / X Days / DD.MM.YYYY

11. DD.MM.YYYY / X Days / DD.MM.YYYY

12. DD.MM.YYYY / X Days / DD.MM.YYYY

13. DD.MM.YYYY / X Days / DD.MM.YYYY

14. Task 5

14.1. End Date: DD.MM.YYYY

15. Latest start / Buffer / Latest completion

16. Latest start / Buffer / Latest completion

17. DD.MM.YYYY / X Days / DD.MM.YYYY

18. DD.MM.YYYY / X Days / DD.MM.YYYY

19. Earliest start / Duration / Earliest completion

20. Latest start / Buffer / Latest completion

21. Latest start / Buffer / Latest completion

22. DD.MM.YYYY / X Days / DD.MM.YYYY

23. Task 1

24. Task 3

25. DD.MM.YYYY / X Days / DD.MM.YYYY

26. Latest start / Buffer / Latest completion