Frigør det fulde potentiale i dine projekter.
Prøv MeisterTask gratis.
Har du ingen konto?
Tilmeld dig Gratis
Brows
Fremhævede Maps
Kategorier
Projektledelse
Forretning og mål
Menneskelige ressourcer
Brainstorming & Analyse
Marketing & Indhold
Uddannelse og noter
Underholdning
Fritid
Teknologi
Design
Opsummeringer
Andre
Sprog
English
Deutsch
Français
Español
Português
Nederlands
Dansk
Русский
日本語
Italiano
简体中文
한국어
Andet
Vis hele kortet
Kopier og rediger map
Kopier
Data Representation (by Group A1)
Andre
SK
S_h_a_r_o_n Khoo
Følg
Kom i gang.
Det er Gratis
Tilmeld dig via Google
eller
tilmeld
med din email adresse
Lignende mindmaps
Mindmap-oversigt
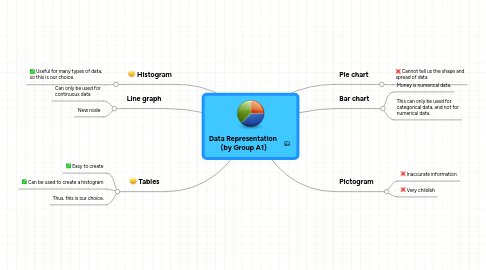
Data Representation (by Group A1)
af
S_h_a_r_o_n Khoo
1. Histogram
1.1. Useful for many types of data, so this is our choice.
2. Tables
2.1. Easy to create
2.2. Can be used to create a histogram
2.3. Thus, this is our choice.
3. Line graph
3.1. Can only be used for continuous data
3.2. New node
4. Pie chart
4.1. Cannot tell us the shape and spread of data
5. Pictogram
5.1. Inaccurate information
5.2. Very childish
6. Bar chart
6.1. Money is numerical data.
6.2. This can only be used for categorical data, and not for numerical data.
Kom i gang. Det er gratis!
Forbind med Google
eller
Tilmeld