Frigør det fulde potentiale i dine projekter.
Prøv MeisterTask gratis.
Har du ingen konto?
Tilmeld dig Gratis
Brows
Fremhævede Maps
Kategorier
Projektledelse
Forretning og mål
Menneskelige ressourcer
Brainstorming & Analyse
Marketing & Indhold
Uddannelse og noter
Underholdning
Fritid
Teknologi
Design
Opsummeringer
Andre
Sprog
English
Deutsch
Français
Español
Português
Nederlands
Dansk
Русский
日本語
Italiano
简体中文
한국어
Andet
Vis hele kortet
Kopier og rediger map
Kopier
Data representation
Andre
WE
W elovenusmath
Følg
Kom i gang.
Det er Gratis
Tilmeld dig via Google
eller
tilmeld
med din email adresse
Lignende mindmaps
Mindmap-oversigt
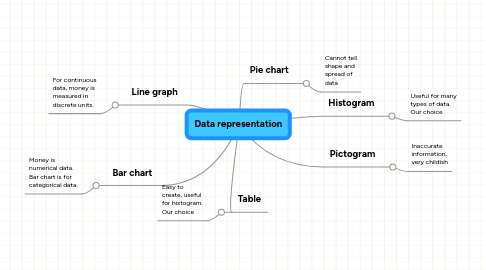
Data representation
af
W elovenusmath
1. Line graph
1.1. For continuous data, money is measured in discrete units.
2. Bar chart
2.1. Money is numerical data. Bar chart is for categorical data.
3. Table
3.1. Easy to create, useful for histogram. Our choice
4. Pie chart
4.1. Cannot tell shape and spread of data
5. Histogram
5.1. Useful for many types of data. Our choice
6. Pictogram
6.1. Inaccurate information, very childish
Kom i gang. Det er gratis!
Forbind med Google
eller
Tilmeld