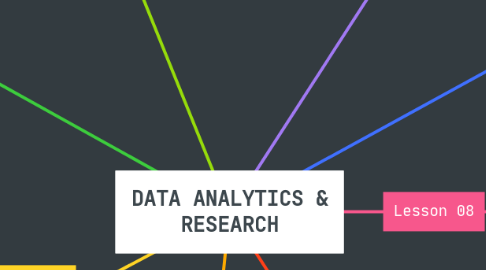
1. 02 Big Data
1.1. Objective of Big Data
1.1.1. 1) Provide objective information about people's behaviour 2) Honest reflection of unfiltered thoughts
1.2. Characteristics of Big Data
1.2.1. Volume - Amount of Data
1.2.2. Velocity - Speed of collecting Data
1.2.3. Variety - Different sources of Data
1.2.3.1. Structured Data - Used in systems already
1.2.3.2. Unstructured Data - Mostly textual
1.2.4. Veracity - Accuracy of Data
1.3. Sources of Data
1.3.1. Transactional & Application Data
1.3.2. Machine Data
1.3.3. Social Data
1.3.4. Enterprise Content
1.4. Level of Data Quality
1.4.1. Utility
1.4.2. Objectivity
1.4.3. Integrity
1.4.4. To prevent GIGO, Garbage in, garbage out
1.4.4.1. To be Presented in an accurate, clear, complate and unbiased manner
1.5. Filtering Data Quality (Prevent duplication)
1.5.1. Data quality and consistency varies
1.5.2. Choice for Filtering Data
1.6. Business Impact
1.6.1. Marketing Campaigns
1.6.2. Business Intelligence & Management Reporting
1.6.3. Corporate Reputation & Compliance
1.6.4. ERP projects
1.6.5. Predictive Analytics
1.7. Data Preparation **Procedures**
1.7.1. Aquire Data (Import)
1.7.2. Field level cleaning
1.7.3. Select relevant data (Remove outlier )
1.7.4. Convert unstructured data to structured data
1.7.5. Aggregate if needed
1.7.6. Combine multiple data sets
1.7.7. Derive new features
1.7.8. Feature selection (Reporting and Viz)
1.7.9. Partition into training and test
1.7.10. Rebalance if necessary for classification (Modelling and Prediction)
1.8. Technique to enhance data quality
1.8.1. Data profiling
1.8.2. Matching
1.8.3. Parsing
1.8.4. Standardisation
1.8.5. Clustering of matched rows
1.8.6. De-duplication
1.8.7. Merging on keys
1.9. Data Cleaning and Preparation
2. 01 Tableau
2.1. Dimension
2.1.1. Definitely, Discrete and Different (Category type stuff)
2.2. Measure
2.2.1. Mostly, Minuscule and Marginal difference (data type stuff)
3. 04 Visualisations, Dashboard Design
3.1. Visualisation
3.1.1. Goal
3.1.1.1. Communicate information clear and effectively through graphical means
3.1.1.2. Cobimnation of form and functionality in an intuitive way (Vitaly Friedman 2008)
3.2. Visualisation Design
3.2.1. 4 pillars of Visualisation Design
3.2.1.1. Clear Purpose
3.2.1.2. Content (Right information)
3.2.1.3. Structured correctly
3.2.1.4. Useful Formatting
3.2.2. Design
3.2.2.1. Colour
3.2.2.2. Size
3.2.2.3. Chart
3.2.2.4. Dashboard
3.3. Presentation Techniques
3.3.1. Effectiveness
3.3.2. Format
3.3.3. Usability
4. 05 Predictive Analytics
4.1. Models
4.1.1. Analyze data to ‘find out things you otherwise wouldn’t know' (Use current data to help furture learning)
4.1.1.1. Knowledge Discovery
4.1.1.2. Machine learning
4.1.2. Use data to drive decision making (Use data from the past to analyze the pattern and make better decion)
4.1.2.1. Predictive Analytics
4.2. Classification Model
4.2.1. Supervised Learning
4.2.2. Unsupervised
4.3. Model Scoring
4.3.1. Classification Models
4.3.2. Regression Model
5. 07 Data Segmentation
5.1. Data Learning
5.1.1. Supervised Learning
5.1.1.1. Classification model
5.1.1.1.1. Examine Build
5.1.1.2. Regression model
5.1.2. Unsupervised Learning
5.1.2.1. Association
5.1.2.2. Clustering/ Segmentation
5.1.2.3. Machine Learning
5.1.2.3.1. **Boundaries** k-NN (k(no.)-Nearest Neighbour)
5.2. Euclidean Distance
6. 06
7. Lesson 08
7.1. Survivor Bias
7.1.1. Opinions are differed with different people with different interest
7.1.2. Clustering- look for patterns
7.2. Problem of Prediction
7.2.1. Under fitting
7.2.1.1. Prevent
7.2.2. Over fitting
7.2.2.1. Prevent
7.2.3. Appropriate fitting
7.2.3.1. To get
7.2.3.1.1. Available Data
7.3. Spotting patterns
7.3.1. Correlations
7.3.2. Causation
