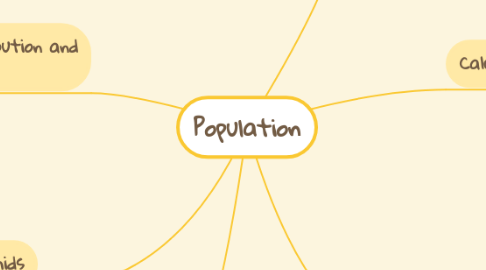
Population
Door Brendley David


1. Over-population and under-population
1.1. A country is UNDERPOPULATED if the number of people is greater than the resources needed
1.2. A country is UNDERPOPULATED if the number of people is less than is needed to meke full use of the resources available
2. Population distribution and density
2.1. POPULATION DISTRIBUTION means the pattern of where people live
2.2. POPULATION DENSITY is the average number of people living in a given area. It's calculated by dividing the total population by the area of land (km2)
3. Population pyramids
3.1. 3 different groups of people
3.1.1. 0-14 are dependants
3.1.2. 15-64 are usually working
3.1.3. 65upwards are dependants
