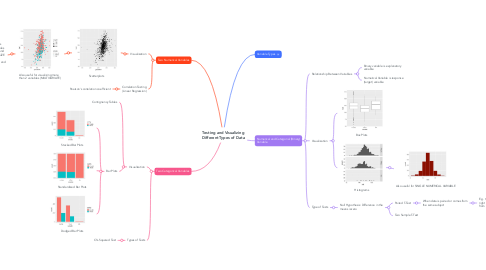
1. Two Numerical Variables
1.1. Visualization
1.1.1. Scatterplots
1.1.1.1. Also useful for visualizing more than 2 variables (MULTIVARIATE)
1.1.1.1.1. This graph shows relationships between three numeric variables (birthweight, gestation time, and weight) using X/Y AXES and SIZE and one categorical variable (smoking status) using SHAPE and COLOR
1.2. Correlation Testing (Linear Regression)
1.2.1. Pearson's correlation coefficient
2. Two Categorical Variables
2.1. Visualization
2.1.1. Contignency Tables
2.1.2. Bar Plots
2.1.2.1. Stacked Bar Plots
2.1.2.2. Standardized Bar Plots
2.1.2.3. Dodged Bar Plots
2.2. Types of Tests
2.2.1. Chi-Squared Test
3. Variable Types
4. Numerical and Categorial (Binary) Variable
4.1. Relationship Between Variables
4.1.1. Binary variable is explanatory variable
4.1.2. Numerical Variable is response (target) variable
4.2. Visualization
4.2.1. Box Plots
4.2.2. Histograms
4.2.2.1. Also useful for SINGLE NUMERICAL VARIABLE
4.3. Type of Tests
4.3.1. Null Hypothesis: Difference in the means is zero
4.3.1.1. Paired T-Test
4.3.1.1.1. When data is paired or comes from the same subject
4.3.1.2. Two Sample T-Test
