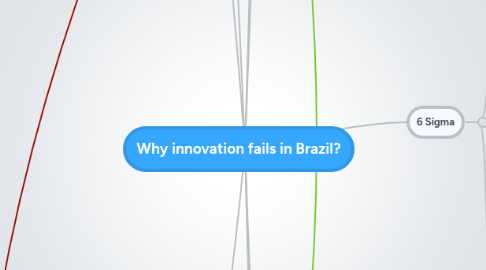
1. Change Management
1.1. HCMBok
1.2. Appreciative Investigation
1.3. Herzberg 2 Factor
1.4. Staff Experience
1.5. Organizational Behavior
1.5.1. Sociology
1.5.1.1. Crozier, 1964
1.5.1.2. Merton, 1957
1.5.1.3. Gouldner, 1954
1.5.1.4. Selznick, 1955
1.5.1.5. Simon, 1947
1.5.1.6. Crozier & Friedberg, 1977
1.5.2. Social Actors
1.5.2.1. Zonas de Incerteza Pertinentes
1.5.2.1.1. Coercion
1.5.2.1.2. Persuasive Manipulation
1.5.2.1.3. Negotiation
2. Service Design
2.1. Service Concept
2.2. Service Recovery
2.2.1. ISO 10002
2.3. Service Quality
2.3.1. Okyakusama
2.3.2. Voice of Client
2.3.2.1. Quality Function Deployment
2.4. Service Processes
2.4.1. Experience
2.4.1.1. Principles
2.4.1.2. Experience Map
2.5. Cases
2.5.1. SAS
2.5.2. Disneyworld
2.5.3. Nordstrom
2.5.4. Apple
2.5.5. Starbucks
2.6. Service Marketing
2.6.1. Process
2.6.2. Physical Evidence
2.6.3. People
3. Entrepreneurship
3.1. Statistics
3.1.1. GEM
3.1.1.1. Beginning Entrepreneurs Profile
3.1.1.1.1. Avoid bureaucracy
3.1.1.2. Entrepreneurship Profile
3.1.1.2.1. Low Tech Content
3.1.1.2.2. Low Entry Barriers
3.1.1.2.3. Toward Internal Market
3.1.1.2.4. Self Managed by Owner
3.1.1.2.5. Products and Services with No Differentiation
3.1.1.2.6. Low Innovation
3.1.1.2.7. Low International Insertion
3.1.1.2.8. Searching for Support = SEBRAE (9,2%) No Support = 84,6%
3.2. Functional Illiteracy
3.2.1. 27% brazilian people are functionally illiterate
3.2.1.1. Only 13% are proficient on functional literacy
3.2.1.2. 100.000 students leave school functionally illiterate in UK
3.2.1.3. 14% of American adults are functionally illiterate
3.2.1.4. 9% are functionally illiterate in France (half of them are employed)
3.2.1.5. 38% of college students in Brazil (INAF Index)
3.2.1.6. BRAZIL: 47% are functionally literate LEVEL BASIC
3.2.1.7. BRAZIL: 26% are functionally literate LEVEL PLAIN
3.2.2. Causes (UNESCO, 1986)
3.2.2.1. Reproduction of familial literacy patterns
3.2.2.2. Impact of television and other electronic mass media on reading skills
3.2.2.3. Learning difficulties from
3.2.2.3.1. pupils' mental or physical handicaps
3.2.2.3.2. cultural conflicts
3.2.2.3.3. environmental milieu
3.2.2.3.4. parents' or classmates' attitudes
3.2.2.4. Focus of employers on limited job specific functions (Harman, 1987)
3.2.2.5. School related problems
3.2.2.5.1. Teaching methods (Flesch, 1981)
3.2.2.5.2. Learning materials (Stubbs, 1980)
3.2.2.5.3. Teachers approach to transmitting levels of cognition
3.2.2.5.4. Teachers' attitudes towards slow learners
3.2.2.5.5. Reading deteriorating effects of multiple choice tests (Wheeler, 1979)
3.2.2.5.6. Counter-productive parent-teacher relationships
3.2.3. Institute dedicated to
3.2.3.1. Instituto Paulo Montenegro
3.2.4. Effects
3.2.4.1. Economic losses
3.2.4.1.1. World
3.2.4.1.2. Brazil
3.2.4.2. Non-productivity in the workforce
3.2.4.3. Crime
3.2.4.4. Unemployment
3.2.4.4.1. Loss of tax revenue
3.2.4.5. Lower financial literacy skills
3.3. Entry barriers
3.3.1. Complex bureaucracy
3.3.1.1. Could use pareto to separate groups of businesses
3.3.2. Competition
3.3.2.1. 5 forces model (Porter)
3.4. Success Factors
3.4.1. Ram Charan
3.4.1.1. Margin
3.4.1.2. Return over assets
3.4.1.3. Growth
3.4.1.4. Cash flow
3.4.1.5. Customers
3.4.1.5.1. Customer Development (Steve Blank)
3.4.1.5.2. 7 Desires
3.5. Business Pillars
3.5.1. Culture
3.5.1.1. Identity
3.5.1.1.1. Mission
3.5.1.1.2. Values
3.5.1.1.3. Vision
3.5.1.1.4. Positioning
4. Process
4.1. Lean
4.1.1. Lean Manufacturing
4.1.2. Lean Service
4.1.2.1. Waste Reduction Techniques
4.1.2.1.1. 5S
4.1.2.1.2. Kaizen
4.1.2.1.3. Kaikaku
4.1.2.2. Information flow
4.2. Training
4.2.1. TWI
4.2.1.1. Job Instruction
4.2.1.2. Job Methods
4.2.1.3. Job Relations
4.2.1.4. Program Development
5. Project
5.1. PMBok
5.1.1. Stages
5.1.1.1. Initiation
5.1.1.2. Planning
5.1.1.3. Execution
5.1.1.4. Monitoring & Control
5.1.1.5. Finishing
5.1.2. Integration
5.1.2.1. Stakeholders
5.1.2.2. Acquisition
5.1.2.3. Communication
5.1.2.4. Costs
5.1.2.5. Risks
5.1.2.6. Human Resources
5.1.2.7. Schedule
5.1.2.8. Scope & Requirements
5.2. PRINCE2
5.3. Agile
5.3.1. SCRUM
6. 6 Sigma
6.1. Method
6.1.1. DMADV (Design for 6 Sigma)
6.1.1.1. Define
6.1.1.2. Measure
6.1.1.3. Analyse
6.1.1.4. Design
6.1.1.5. Verify
6.1.2. DMAIC
6.1.2.1. Control
6.1.2.1.1. CEP
6.1.2.1.2. FMEA
6.1.2.1.3. ISO 900x
6.1.2.1.4. Revise proposals, cost estimation
6.1.2.1.5. Information Delivery System
6.1.2.2. Improve
6.1.2.2.1. Force Shield Analysis Diagram
6.1.2.2.2. FMEA
6.1.2.2.3. 7M Tools
6.1.2.2.4. Project Management
6.1.2.2.5. Prototype studies
6.1.2.2.6. Simulation
6.1.2.3. Analyse
6.1.2.3.1. Cause Effect Diagram
6.1.2.3.2. Tree Diagram
6.1.2.3.3. Brainstorming
6.1.2.3.4. Control Charts
6.1.2.3.5. Process Mapping
6.1.2.3.6. Experiment Project
6.1.2.3.7. Hypothesis Test
6.1.2.3.8. Inferential Statistics
6.1.2.3.9. Simulation
6.1.2.4. Measure
6.1.2.4.1. Measurement System Analysis
6.1.2.4.2. Control Charts
6.1.2.4.3. Data Exploration Analysis
6.1.2.4.4. Descriptive Statistics
6.1.2.4.5. Data Mining
6.1.2.4.6. Execution Graph
6.1.2.4.7. Pareto Analysis
6.1.2.5. Define
6.1.2.5.1. Project Charter
6.1.2.5.2. VOC Tools
6.1.2.5.3. Process mapping
6.1.2.5.4. QFD
6.1.2.5.5. SIPOC
6.1.2.5.6. Benchmarking
6.1.2.5.7. Project Management
6.1.2.5.8. Pareto Analysis
6.1.3. 10 Stage service life cycle
6.1.3.1. Idea Creation
6.1.3.2. VOC and Business
6.1.3.3. Concept Development
6.1.3.4. Preliminary Design
6.1.3.5. Design Optimization
6.1.3.6. Verification
6.1.3.7. Launch Readiness
6.1.3.8. Mass production
6.1.3.9. Service consumption
6.1.3.10. Disposal/Phase out
6.2. Variation Reduction Techniques
6.2.1. Choosing Processes
6.2.1.1. QFD
6.2.1.1.1. Critical Factors to Quality (CTQ Tree)
6.2.2. Axiomatic Design
6.2.3. Business Process Mapping
6.2.4. Control chart
6.2.5. Design of Experiments
6.2.6. Root Cause Analysis
6.2.6.1. 5W
6.2.6.2. Ishikawa Diagram
6.2.7. Pareto Analysis
6.2.8. Process capability
6.2.9. Enterprise Feedback Management
6.2.10. SIPOC analysis
6.2.11. Taguchi methods
6.2.12. Value Stream Mapping
6.2.13. Statistical tools
6.2.13.1. Analysis of variance
6.2.13.2. ANOVA R&R
6.2.13.3. Regression analysis
6.2.13.4. Correlation
6.2.13.5. Scatter Diagram
6.2.13.6. Chi-squared test
7. Innovation
7.1. Creativity
7.1.1. Parallel Thinking
7.1.1.1. Shift
7.1.1.2. Analogy
7.1.1.3. Comparison
7.1.2. Creative Insights
7.1.3. Pattern Detection
7.1.4. Sinectics
7.1.5. Blue Ocean
7.1.6. Morphological Analysis
7.1.7. List of attributes
7.1.8. Trips and visits
7.1.9. Co-creation
7.1.10. Customer Value Redefinition
7.1.11. Scenario analysis
8. Design
8.1. Methods
8.1.1. Double Diamond
8.1.2. Sless
8.1.3. Frascara
8.1.4. Innovation Model
8.1.4.1. Kumar (2013)
8.1.4.2. Sense Intent
8.1.4.3. Know User
8.1.4.4. Know Context
8.1.4.5. Frame Insights
8.1.4.6. Ideate
8.1.4.7. Implement
8.2. Co-evolution
8.2.1. Problem space
8.2.2. Solution space

