Unlock the full potential of your projects.
Try MeisterTask for free.
Heb je nog geen account?
Meld je Gratis aan
Browse
Aanbevolen kaarten
Rubrieken
Project management
Zakelijke doelen
Personeelszaken
Brainstormen en analyseren
Marketing & Inhoud
Onderwijs en notities
Entertainment
Leven
Technologie
Ontwerp
Samenvattingen
Andere
Talen
English
Deutsch
Français
Español
Português
Nederlands
Dansk
Русский
日本語
Italiano
简体中文
한국어
Andere
Toon volledige map
Communication Functions of Graphics
Onderwijs en notities
Azlin Aziz
Volg
Laten we beginnen.
Het is Gratis
Login met Google
of
registreren
met je e-mailadres
Vergelijkbare mind mappen
Overzicht van map
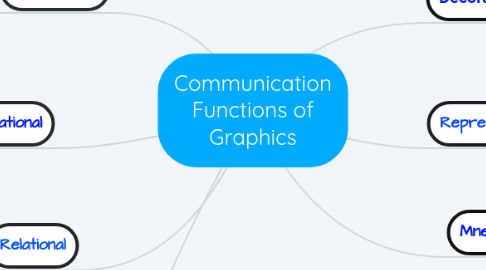
Communication Functions of Graphics
Door
Azlin Aziz
1. Organizational
1.1. A graphic used to show qualitative relationships among content
1.2. For examples, a two-dimensional course map or a concept tree
2. Relational
2.1. A graphic used to show quantitative relationships among two or more variables
2.2. For examples, a line graph or a pie chart.
3. Transformational
3.1. A graphic used to show changes in objects over time or space
3.2. For examples, an animation of the weather cycle or a video showing how to operate equipment
4. Interpretive
4.1. A graphic used to illustrate a theory, principle, or cause-and-effect relationships
4.2. For examples, a schematic diagram of equipment and an animation of molecular movement
5. Decorative
5.1. A Graphic used to add aesthetic appeal or humor
5.2. For examples, art on the cover of a book or visual of a general in a military lesson on ammunition
6. Representational
6.1. A graphic used to depict an object in a realistic fashion
6.2. For examples, a screen capture of a software screen or a photograph of equipment
7. Mnemonic
7.1. A graphic used to provide retrieval cues for factual information
7.2. For example, a picture of a stamped letter in a shopping cart to recall the meaning of the Spanish word, Carta (letter)
Begin. Het is gratis!
Verbind met Google
of
Registreren