Unlock the full potential of your projects.
Try MeisterTask for free.
Heb je nog geen account?
Meld je Gratis aan
Browse
Aanbevolen kaarten
Rubrieken
Project management
Zakelijke doelen
Personeelszaken
Brainstormen en analyseren
Marketing & Inhoud
Onderwijs en notities
Entertainment
Leven
Technologie
Ontwerp
Samenvattingen
Andere
Talen
English
Deutsch
Français
Español
Português
Nederlands
Dansk
Русский
日本語
Italiano
简体中文
한국어
Andere
Toon volledige map
Kopieer en bewerk map
Kopieer
Statistics
Andere
Dikeledi mogorosi
Volg
Laten we beginnen.
Het is Gratis
Login met Google
of
registreren
met je e-mailadres
Vergelijkbare mind mappen
Overzicht van map
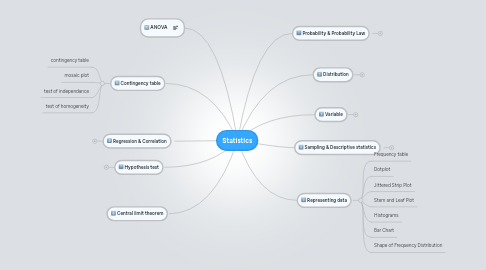
Statistics
Door
Dikeledi mogorosi
1. ANOVA
2. Contingency table
2.1. contingency table
2.2. mosaic plot
2.3. test of independance
2.4. test of homogeneity
3. Regression & Correlation
3.1. simple linéar regression
3.2. evaluating linear fits
3.3. multiple linear regression
3.4. correlation
3.5. correlation and causation
4. Hypothesis test
4.1. Hypothesis testing
4.2. One sample t test
4.3. Z test
4.4. confidence interval
4.5. Paired T Test
4.6. Two Sample T test
4.7. one-tailed and two-tailed tests
4.8. procedure of hypothesis testing
4.9. decision errors
4.10. Power analysis
4.11. explanation on output of t test
5. Central limit theorem
6. Probability & Probability Law
6.1. Probability
6.2. Probability Law
6.3. Random Variable
6.4. Probability distribution (discrete case)
6.5. Probability distribution (continuous case)
7. Distribution
7.1. Binomial Distribution
7.2. Poisson
7.3. Geometric
7.4. Negative binomial
7.5. Normal Distribution
7.6. Score
7.7. Student t
7.8. exponential
7.9. Chi-Square
7.10. Snedecor's F
8. Variable
8.1. Data Set
8.2. Variable Type
9. Sampling & Descriptive statistics
9.1. Sample and Population
9.2. Descriptive statistics
9.3. Population mean vs Sample mean
9.4. Population variance vs Sample variance
9.5. Quantiles
9.6. Box Plot
10. Representing data
10.1. Frequency table
10.2. Dotplot
10.3. Jittered Strip Plot
10.4. Stem and Leaf Plot
10.5. Histograms
10.6. Bar Chart
10.7. Shape of Frequency Distribution
Begin. Het is gratis!
Verbind met Google
of
Registreren