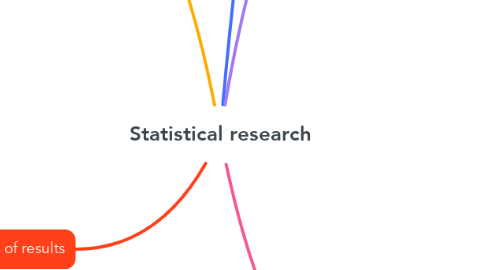
1. 5. Results presentation
1.1. Statistical information can be presented in text, in tables and/or figures, following the following recommendations: if three or less numbers are presented, a sentence should be used; in case of presenting more than 4 up to 20 numbers, try to use a table; and more than 20 numbers it is preferable to use graphics.
2. 4. Analysis of results
2.1. The analysis of the data will have to do with the formulation of the very objective of the investigation and the established hypotheses; however, this analysis process will be less difficult if the researcher is fully aware of the problems that are inherent in research planning. In this process, the elaboration of distributions or tables of frequencies obtained through a systematization of the information must be considered to be able to be presented in the form of charts and graphs. With the previous results, we then proceed to make a summary and apply the different measures that we have called punctual statisticians or estimators, when they are applied to the characteristics of the units in the sample or as parameters applied to the characteristics of the population, among Which show the measures of dispersion and the averages, including in these the percentages and proportions.
3. 1. planning
3.1. The previous establishment of a plan is required that details the aspects that the investigation is going to cover, that establishes the procedures to be followed, and that resolves in advance the possible difficulties that are presumed to have arisen.
3.1.1. • The object of the investigation • The purpose • The source of information • The procedures • The material • The cost and its financing
4. 2. harvest
4.1. The entire subsequent result of statistics depends on this task. If it is poorly done, the elaboration will be incorrect and even impossible to carry out, and if it is carried out, it will give rise to an erroneous analysis and false interpretations.
4.2. The collection stage comprises several aspects:
4.2.1. • Distribution of the collection material or instrument • The collection itself • Control of the number of collected forms • Control over the quality of the information collected
5. 3. Organization
5.1. The organization. It must be studied in a project; what form is going to be given to the organization of the statistics in question. There are two tendencies: centralist and decentralist.
5.1.1. centralization. It is unquestionably necessary in the technical order. The technique, the general rules, the direction of all research must be central and general for the entire territory, for the field of each investigation and for all lower bodies and personnel involved. It is the only right and means to achieve unity in the systems and to be able to totalize the data of an entire municipality, an entire department, or the country as a whole. If each section is left to compile the statistics it wants and by whatever means it thinks of, regional differences will make it impossible to assemble the data into national totals and even make interregional comparisons impossible.
5.1.2. decentralization. It must be used in the administrative order, in the executive order, to select personnel, to cooperate in the statistical budget, to provide the material, to collect the data, to control the quality of the investigations, to, finally, serve as a intermediary between the various categories of dependencies. It is clear that centralization, in no case, can correspond to absolute uniformity in essentials and accidents. The central management must take into account the regional particularities of the fact or phenomenon that is statistically investigated, in order to adjust the project to the different geographical characteristics.
