
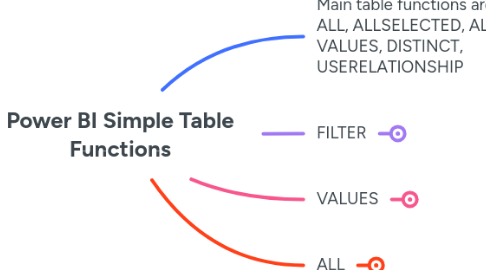
1. Main table functions are: FILTER, ALL, ALLSELECTED, ALLEXCEPT, VALUES, DISTINCT, USERELATIONSHIP
1.1. Key thing to remember about all table functions is that they create virtual tables inside your measures
1.2. Table functions can be used in any function where you can place a table or filter
1.3. Table functions allow you to dictate what an underlying table looks like before a calculation takes place
1.3.1. Remember that evaluation context always applies first and these table functions provide a way to add to or subtract from the table created by evaluation context before the outer calculation of the measure happens
1.4. The only way to really understand table functions is to practice with many examples and testing results
1.4.1. There is no way to directly visualise the virtual tables created by these table functions
2. FILTER
2.1. We most commonly use this function with the CALCULATE function
2.1.1. When we talk about CALCULATE changing or breaking context, this means that it forces the calculation expression to happen in the base evaluation context with subtractions made by the FILTER function
2.1.1.1. So the values returned by CALCULATE are not disregarding evaluation context, they are extending that context by way of subtraction, defined by FILTER
2.2. Example #1:
2.2.1. High Export Sales = CALCULATE( [Total Sales], FILTER('Sales', Sales[Order Quantity] > 10 && Sales[Channel Index] = 3 ) )
2.2.1.1. The expression is [Total Sales], which is a measure that sums the 'Sales'[Total Revenue] column
2.2.1.2. When we add the [High Export Sales] measure to a report visual, evaluation context applies first, which may give us a reduced 'Sales' table, then a virtual table is created by FILTER, which further reduces the (potentially already) reduced 'Sales' table further by returning only rows where quantity is over 10 and channel is 3 (Export channel)
2.2.1.2.1. We can look at the calculation in report context
2.3. Example #2
2.3.1. High Revenue Sales = CALCULATE( [Total Sales], FILTER('Sales', [Total Sales] > 20000 ) )
2.3.1.1. Thing to note here is that we can also use another measure within the filter expression (i.e. we are not limited to only using 'Sales' table columns. However, there are some restrictions to be mindful of.
2.3.1.1.1. Restrictions when using other measures in filter expression:
2.4. Tip for visualising virtual table produced by FILTER (or any other table function)
2.4.1. Go to Table view, Table Tools and click New table
2.4.1.1. Create a new table using just the FILTER function and note the reduction in rows
2.4.1.1.1. You have to bear in mind that evaluation context still applies as the base reduction to the table in question when considering the values returned by CALCULATE in a report visual
3. VALUES
3.1. This takes a single table or column as input parameter and produces a virtual table showing only distinct values from that table or column, within the base evaluation context
3.1.1. Use the "New table" trick to visualise what it does
3.1.1.1. See how VALUES returns only distinct values
3.2. We generally use this function as an argument for other functions that require a table argument
3.3. Example: calculate average warehouse sales
3.3.1. Average Warehouse Sales = AVERAGEX( VALUES( 'Sales'[Warehouse Index] ), [Total Sales] )
3.3.1.1. Now let's look at the measure in the evaluation context of a table visual
3.3.1.1.1. Here we see in the highlighted cases that VALUES returns distinct warehouses that had sales on 16-Aug-2019 and 17-Aug-2019, and we get [Total Sales] average for each day
3.3.1.2. Note that the AVERAGEX function takes a table as its first argument, but this does not have to be a physical table, it can be a virtual table that are produced by table functions like VALUES
3.4. VALUES vs DISTINCT
3.4.1. DISTINCT does the same thing as VALUES except that DISTINCT eliminates blank values from results and VALUES does not
3.4.1.1. If there were 1 or more records in the 'Sales' table where [Channel Index] was blank, VALUES might return 4 channels (3 actual channels plus a blank) in a certain context, whereas DISTINCT would return 3 channels.
3.4.1.2. We can imagine the scenario of summing 'Sales'[Sales Amount] in a fact table where 'Sales' has a many-to-one relationship with the 'Customer' table, based on 'Sales'[Customer Id] = 'Customer'[Customer Id]. Let's suppose that there are records in 'Sales' for which there are not yet any corresponding record in 'Customer' and that this is represented by 'Sales'[Customer Id] including blank values.
3.4.1.2.1. We could have this measure, which will sum up 'Sales'[Sales Amount] regardless of whether there's a 'Customer' record or not:
3.4.1.2.2. In contrast, we could have this measure that will only give us the sum of 'Sales'[Sales Amount] where 'Sales'[Customer Id] is not blank:
3.4.1.2.3. When we consider that the following formula, which is the same as the one above but simply changes DISTINCT for VALUES, is actually the same as the first (i.e. the use of VALUES is redundant in this formula because it acts as if no filter is being applied), we can grasp the difference between the functions more clearly
3.4.1.3. One argument for using VALUES rather than DISTINCT is that you should put effort into your data modelling to guard against relationship problems and also that VALUES will highlight any such issues whereas DISTINCT will sweep them under the carpet
3.5. VALUES vs SELECTEDVALUE
3.5.1. SELECTEDVALUE was introduced to Power BI later as a more elegant solution to solving a particular use case for VALUES
3.5.1.1. To grasp this concept, we must first understand that every measure must return a scalar value in context and lists of values are prohibited
3.5.1.1.1. To demonstrate this, we can create the following measure and when we drag this onto a table visual where we know VALUES will produce more than one result, we see that the visual fails
3.5.1.2. Next, we can imagine a use of VALUES where we expect a single value per row to be returned (this is a contrived and dumb example, but helps illustrate the point)
3.5.1.2.1. Let's duplicate the table and swap out date for customer name
3.5.1.2.2. Now let's change our measure to return customer name index values from Sales
3.5.1.2.3. When we drag this measure into the table visual we get the same error but this is only because of the totals
3.5.1.2.4. We can prove this by disabling the totals on the table visual
3.5.1.2.5. If you want to enable the table visual totals and still use this measure, the old way would involve wrapping measure expression in an IF function and utilising another function called HASONEVALUE. However, this is simplified by the SELECTEDVALUE function as follows:
4. ALL
4.1. This table function removes filters and is normally used with the CALCULATE function
4.1.1. Let's consider the following table visual and a common requirement might be to calculate the percentage of sales per customer of the grand total of sales
4.1.1.1. We see the total at bottom and need a way to use that in every row
4.1.1.2. Let's create a measure to capture that bottom line total in a way that will repeat for each row in this table visual
4.1.1.2.1. All Customer Sales = CALCULATE( [Total Sales], ALL( Customers ) )
4.1.1.3. Now we can use branching to calculate the percentage of sales for each customer
4.1.1.3.1. % of Total Customer Sales = DIVIDE( [Total Sales], [All Customer Sales], 0 )
4.1.1.4. When we say that ALL removes filters, we mean that it removes filters relating to the specified table or column from the visual that the measure using ALL is added to
4.1.1.4.1. If we adjust a date slicer on the page, for example, we can see that the totals automatically adjust
4.1.1.4.2. But if we add an attribute from another table, let's say the Channel table, our measure starts returning different numbers
4.2. ALL vs ALLEXCEPT
4.2.1. The ALLEXPECT function removes all context filters from the specified table apart from those applied by specific columns
4.2.1.1. Let's consider a scenario. We've got a table visual that shows [Total Sales] per customer per channel. What we want is to calculate the % of total sales per channel with retaining the customer context.
4.2.1.1.1. We want to divide the [Total Sales] by the sum of [Total Sales] per customer.
4.3. ALL vs ALLSELECTED
4.3.1. The ALLSELECTED function removes context filters applied to a specific table whilst simultaneously respecting a separate filtering selection made on another visual or slicer.
4.3.1.1. This function is most commonly used for calculating cumulative totals in combination with the Dates table, so let's look at an example of that.
4.3.1.1.1. Firstly, let's define a cumulative totals measure that uses the ALL function.
4.3.1.1.2. Next, let's bring that measure onto a table visual on a page that also has a date slicer.
4.3.1.1.3. Now let's alter the measure to use ALLSELECTED so that it respects the date slicer selection.
4.3.1.1.4. We now see in the table visual that we are getting cumulative totals per date that are also respecting the selection made on the date slicer