Unlock the full potential of your projects.
Try MeisterTask for free.
Heb je nog geen account?
Meld je Gratis aan
Browse
Aanbevolen kaarten
Rubrieken
Project management
Zakelijke doelen
Personeelszaken
Brainstormen en analyseren
Marketing & Inhoud
Onderwijs en notities
Entertainment
Leven
Technologie
Ontwerp
Samenvattingen
Andere
Talen
English
Deutsch
Français
Español
Português
Nederlands
Dansk
Русский
日本語
Italiano
简体中文
한국어
Andere
Toon volledige map
Kopieer en bewerk map
Kopieer
Data representation
Andere
WE
W elovenusmath
Volg
Laten we beginnen.
Het is Gratis
Login met Google
of
registreren
met je e-mailadres
Vergelijkbare mind mappen
Overzicht van map
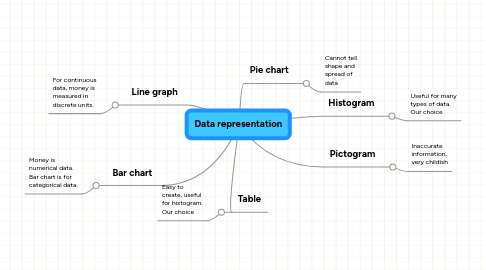
Data representation
Door
W elovenusmath
1. Line graph
1.1. For continuous data, money is measured in discrete units.
2. Bar chart
2.1. Money is numerical data. Bar chart is for categorical data.
3. Table
3.1. Easy to create, useful for histogram. Our choice
4. Pie chart
4.1. Cannot tell shape and spread of data
5. Histogram
5.1. Useful for many types of data. Our choice
6. Pictogram
6.1. Inaccurate information, very childish
Begin. Het is gratis!
Verbind met Google
of
Registreren