Unlock the full potential of your projects.
Try MeisterTask for free.
Heb je nog geen account?
Meld je Gratis aan
Browse
Aanbevolen kaarten
Rubrieken
Project management
Zakelijke doelen
Personeelszaken
Brainstormen en analyseren
Marketing & Inhoud
Onderwijs en notities
Entertainment
Leven
Technologie
Ontwerp
Samenvattingen
Andere
Talen
English
Deutsch
Français
Español
Português
Nederlands
Dansk
Русский
日本語
Italiano
简体中文
한국어
Andere
Toon volledige map
Statistics
Andere
Mary Hesler
Volg
Laten we beginnen.
Het is Gratis
Login met Google
of
registreren
met je e-mailadres
Vergelijkbare mind mappen
Overzicht van map
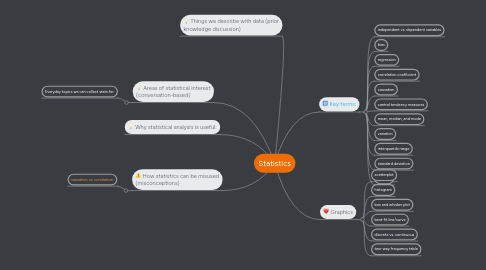
Statistics
Door
Mary Hesler
1. Things we describe with data (prior knowledge discussion)
2. How statistics can be misused (misconceptions)
2.1. causation vs. correlation:
3. Areas of statistical interest (conversation-based)
3.1. Everyday topics we can collect stats for:
4. Why statistical analysis is useful:
5. Key terms:
5.1. independent vs. dependent variables
5.2. bias
5.3. regression
5.4. correlation coefficient
5.5. causation
5.6. central tendency measures
5.7. mean, median, and mode
5.8. variation
5.9. interquartile range
5.10. standard deviation
5.11. outliers
6. Graphics
6.1. scatterplot
6.2. histogram
6.3. box and whisker plot
6.4. best-fit line/curve
6.5. discrete vs. continuous
6.6. two-way frequency table
Begin. Het is gratis!
Verbind met Google
of
Registreren