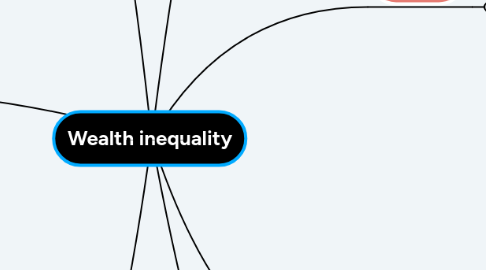
1. % Gini Coefficient
1.1. Definition
1.1.1. A statistical measure of inequality represented in a set of values, mostly used for income inequality
1.2. America
1.2.1. Around 0.4-0.45
1.2.2. Pennsylvania
1.2.2.1. 0.461
2. Forbes 400
2.1. 400 richest people in America
2.1.1. 1.7 trillion dollars
2.1.1.1. More than the bottom 60% of Americans
2.1.1.1.1. 60%= 200,000,000 Americans
2.1.2. 1% of the 1% of the 1%
3. History
3.1. Gilded Age
3.1.1. Late 19th century
3.1.2. "glittering on the surface, but corrupt underneath"
3.1.2.1. Mark Twain
3.1.2.1.1. American writer and entrepreneur
3.1.3. Era of corruption and unrestrained capitalism
3.1.3.1. Capitalism
3.1.3.1.1. the means for producing and distributing goods are owned by a small minority of people
3.1.4. Income inequality has sharply increased in the United States since
4. Results
4.1. Crime rate
4.2. Health
4.3. Political inequality
4.3.1. When certain individuals or groups have a greater influence on political decisions and benefit from their unequal outcomes
4.4. Education
4.5. Fairness
5. Definition
5.1. The unequal distribution of assets among residents
5.1.1. "Assets"
5.1.1.1. Automobiles
5.1.1.2. Businesses
5.1.1.3. Investments
5.1.1.4. Personal Valuables
5.1.1.5. Savings
5.1.1.6. Values of homes
6. Different sides to the argument
6.1. Wealth inequality is...
6.1.1. Good
6.1.1.1. need the right amount of wealth inequality to motivate people to seek a better financial future
6.1.1.1.1. healthy and necessary for a growing economy
6.1.1.2. You are free to pursue a path in life that you believe best suits your talents
6.1.1.2.1. The person decides where and how much they want to work and how much they want to buy/sell
6.1.2. Bad
6.1.2.1. Wealth inequality at its highest since the Great Depression
6.1.2.1.1. It is an endless cycle
6.1.2.2. For every dollar in American assets about 40% goes to the top 1%
7. Factors
7.1. Education
7.2. Growth in technology
7.3. Gender
7.3.1. Women with a full time job make about 77% of what men with the same jobs make
