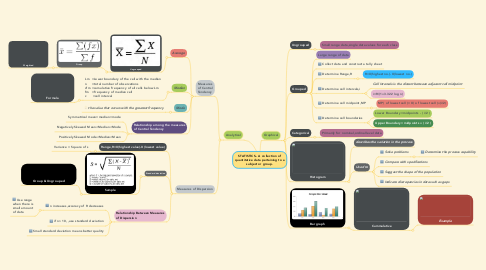
STATISTICS-- A collection of quantitative data pertaining to a subject or group.


1. Analytical
1.1. Measures of Central Tendency
1.1.1. Average
1.1.1.1. Ungrouped
1.1.1.1.1. Group
1.1.2. Median
1.1.2.1. Lm =Lower boundary of the cell with the median n =total number of observations cfm =cumulative frequency of all cells below Lm fm =frequency of median cell c =cell interval
1.1.2.1.1. Formula
1.1.3. Mode
1.1.3.1. the value that occurs with the greatest frequency
1.1.4. Relationship among the measures of Central Tendency
1.1.4.1. Symmetrical mean=median=mode
1.1.4.2. Negatively Skewed Mean<Median<Mode
1.1.4.3. Positively Skewed Mode<Median<Mean
1.2. Measures of Dispersion
1.2.1. Range,R=X(highest value)-X(lowest value)
1.2.1.1. Variance = Square of s
1.2.2. Standard deviation
1.2.2.1. Sample
1.2.2.1.1. Group & Ungrouped
1.2.3. Relationship Between Measures of Dispersion
1.2.3.1. n increases,accuracy of R decreases
1.2.3.1.1. Use range when there is small amount of data
1.2.3.2. if n> 10, ,use standard deviation
1.2.3.3. Small standard deviation means better quality
2. Graphical
2.1. Ungrouped
2.1.1. Small range data,single data values for each class
2.2. Grouped
2.2.1. Large range of data
2.2.2. Collect data and construct a tally sheet
2.2.3. Determine Range,R
2.2.3.1. R=X(highest no.)-X(lowest no.)
2.2.4. Determine cell intervals,i
2.2.4.1. Cell Intervals is the distant between adjacent cell midpoint
2.2.4.2. i=R/(1+3.322 log n)
2.2.5. Determine cell midpoint,MP
2.2.5.1. MP( of lowest cell )= X( of lowest cell )+(i/2)
2.2.6. Determine cell boundaries
2.2.6.1. Lower Boundary =midpoints - ( i/2 )
2.2.6.2. Upper Boundary =midpoints + ( i/2 )
2.3. Categorical
2.3.1. Primarily for nominal,ordinal level data
2.4. Histogram
2.4.1. describes the variation in the process
2.4.2. Used to
2.4.2.1. Solve problems
2.4.2.1.1. Determine the process capability
2.4.2.2. Compare with specifications
2.4.2.3. Suggest the shape of the population
2.4.2.4. Indicate discrepancies in data such as gaps
2.5. Bar graph
2.5.1. Cummulative
2.5.1.1. Example