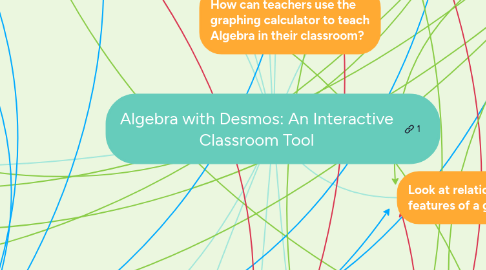
1. Learning Goals for Students
1.1. The format of the lesson can allow teachers to make the learning objective visible to students!
1.2. Desmos is a great tool for collaborative or individual work! Students can contribute to a shared discussion or work individually to meet their learning goal.
1.3. The website gives the students feedback on how they are doing and it gives them the chance to get better at the type of math they are doing.
2. Assessment of Student Learning
2.1. Desmos Activity Builder comes with a quiz feature built in
2.2. Students have to answer questions as they move through the presentation
2.2.1. Easily see student answers and contributions
2.2.2. Teacher gets to decide whether or not students can see the contributions their classmates made to the lesson!
3. Making student progress visible
3.1. Students can see how far they've worked through the activity that you've built.
3.2. If it's appropriate for the activity, allowing students to see the progress and ideas of their classmates can make for a more mathematically rich activity overall.
3.3. The teacher can make a classroom gallery where the students can see each others progress and questions they have on certain activities.
4. What standards is Desmos a tool for?
4.1. Ratios and Proportions
4.1.1. 6th grade
4.1.1.1. Learning to graph on a coordinate plane.
4.1.2. 7th grade
4.1.2.1. Explaining the relationship between two plotted values.
4.2. Expressions, Equations, and Inequalities
4.2.1. 6th grade
4.2.1.1. Graph the solution of the inequality.
4.2.2. 7th grade
4.2.2.1. Write and graph inequalities. Desmos has a built-in feature to help students write inequalities and to see the solution set of the problem.
4.2.3. 8th grade
4.2.3.1. Graph proportional relationships.
5. Students can easily manipulate graphs to solve systems of equations.
6. How can teachers use the graphing calculator to teach Algebra in their classroom?
7. Is Desmos a good tool for teachers to use in their classrooms?
7.1. Yes! The interactivity of the program allows students to manipulate graphs in a way that isn't possible with a pencil and paper.
7.2. Students will appreciate the visual aspect of the program and will enjoy getting to work with an online program.
7.3. Real teacher feedback: "#desmos is incredible for visually showing math, and creating interactive tutorials where students can "do" and collaborate #627fall17"- @PMendricks
8. What is Desmos?
8.1. Desmos is a free online tool that wants to help all ages of students with math and encourage the love for math.
8.2. Desmos comes equipped with an online graphing calculator that is enabled with extra tools to help students build and interact with graphs.
8.3. Desmos has expanded over the years with the amount of people who use it to help their students.
8.4. Desmos also allows teachers to build interactive, digital activities for their students and enables them to share those activities with other users of the site.
9. Hope this is helpful! Try Algebra in your class today!
10. Graphing
10.1. Easily graph any function
10.2. Highlight key features of the graph
10.2.1. These features may include x and y intercepts, maxima and minima, and asymptotes.
11. Look at relationships between features of a graph
11.1. "Sliders" allow students to change values of standard form equations
11.1.1. This helps students see what each portion of a standard form equation represents
11.1.2. Teachers can ask students guiding questions to help them realize what the variables mean
