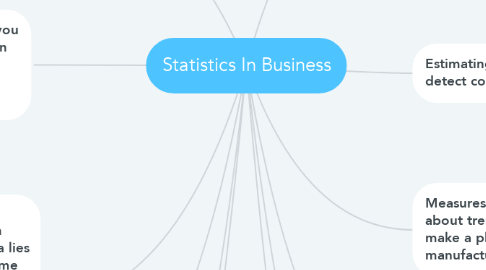
Statistics In Business
by Kalaisha Sha
1. Probability and Random Variables where probability is the foundation of business statistics- basic formula: P(A)=number of outcomes that give A/number of possible outcomes=r/n
2. Inferential statistics where it take data and make sort of conclusion-Main areas: Parameter Estimation & The Hypothesis Test
3. Time Series analysis- A time series graph which is called as timeplot, where plot values against time.
4. Tools used mean, mode and median,bar graphs,bell curve,basic probability.
5. Hypothesis testing (where you test out an idea), Regression analysis(fitting data to an equation) builds on this foundation.
6. Measures of Dispersion- Interquartile range-useful in where the bulk of your data lies and less interested in extreme values.
7. Takes the data analysis tools from elementary statistics and applies them to business.
8. Estimating the probability of a detect coming off a factory line.
9. Measures of association- Tell you about trends in data such as make a plot showing current manufacturing costs.
10. Probability Distribution can be discrete or continuous.For example: include the Binomial Distribution.
11. Simple linear regression and correlation which used in business statistics to predict trends.
12. Use of Index Numbers in economic Data tells how something performs over time and always starts at given year at 100%. It is easier to compare something from an earlier year to a later year.

