1. nm
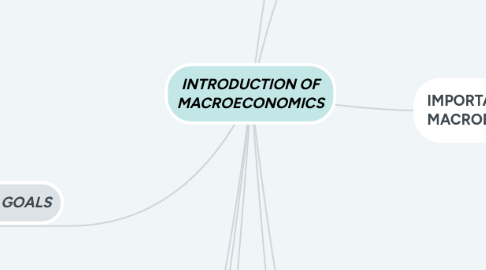
2. MACROECONOMICS GOALS
2.1. Achieving full employment
2.1.1. Full employment is achieved when all available resources are used to produce goods and services, and commonly indicated by the employment of labour resources
2.2. Maintain price stability
2.2.1. Achieved by avoiding or limiting fluctuations in production, employment and prices
2.2.2. Seeks to avoid the recessionary declines and inflationary expansions of business cycle.
2.3. Sustainable good economic growth
2.3.1. Achieved by increasing the economy’s ability to produce goods and services Indicated by increases in the quantities of the resources
2.3.2. Indicated by increases in the quantities of the resources
2.4. Competitive international trade
2.4.1. A country carrying out an open economic policy and actively involved in international trade is believed to reach a higher level of production, consumption and aggregate economic welfare than a closed economy.
2.5. Fair and equitable distribution of income
2.5.1. A more equitable distribution of income may help accelerate growth and promote economic development
2.6. Satisfactory equilibrium in balance of payments
2.6.1. Equilibrium in the balance of payments without the use of artificial constraints results in experts roughly being equal to imports over the long run
3. MACROECONOMICS PROBLEMS
3.1. Trade cycle
3.2. Unemployment
3.3. Inflation
3.4. Deficit balance of payment
4. AGGREGATE DEMAND AND AGGREGATE SUPPLY
4.1. Aggregate Output and Price Level
4.1.1. Aggregate output – The total sum of an economy’s production of goods and services in a given period Price level – The weighted average of the prices of all goods and services
4.2. Aggregate Demand
4.2.1. The total amount of goods and services demanded in the economy at a given overall price level and in a give time period Aggregate demand curve – A graph showing the connection between price level of economy with the total aggregate output in a given period
5. DETERMINANT FACTORS AFFECTING THE SUPPLY CURVE
5.1. 1. Costs of production
5.1.1. Lower costs of production being able to produce a higher quantity of goods and services will make the aggregate supply curve will shift to the right.
5.2. 2. Economic growth
5.2.1. An increase in the quantity of real GDP supplied will shift the aggregate supply curve to the right.
5.3. 3. Technology
5.3.1. A new technology of production will help increase the output, the aggregate supply curve will shift to the right
5.4. 4. Incentives
5.4.1. -Public policies will allow firms to increase their investments. -Hence, the quantity supplied increases and the aggregate supply curve will shift to the right
6. DEFINITON
6.1. A field of economics that studies the relationship between aggregate variables such as income, purchasing income, price and money.
6.2. Examines the function of the economy as a whole system, looking at how demand and supply of products, services and resources are determined and the factors that influence them.
6.3. Goal : to explain the economic changes that affect many households, firms, and markets at once
7. THE DIFFERENCE BETWEEN MICROECONOMICS AND MACROECONOMICS
7.1. Microeconomics examines small economic units, the components of the economy.
7.1.1. For example : individuals, households, firms, industries
7.2. Macroeconomics looks at aggregates.
7.2.1. For example : national output, overall price level, aggregate unemployment.
8. IMPORTANT VARIABLES IN MACROECONOMICS
8.1. National Income / National Output
8.1.1. Concept GDP : -GDP at current prices is the national output price that is measured according to market price for the year. -GNP at constant prices/Real GDP is the national output that is measured according to a base year. * Real GDP = GDP at current price x CPI for the base year current CPI
8.2. Employment
8.2.1. -Refers to the total labour force employed by the various economic activities to produce goods and services within a country. Employment = Total labour force – Total unemployment
8.3. Unemployment
8.3.1. -Refers to the total labour force that is not used by other economic sectors in the production of goods and services Employment rate = Total Unemployment x 100% Total Work force
8.4. Inflation
8.4.1. -Situation where there is a continued and unrestricted increase in the general price level -It refers to a situation where too much money is chasing few goods. Inflation rate = Current year pruce index – Previous year price index x 100% Previous year price index
8.5. Balance of payment
8.5.1. -A financial statement showing the record of a country’s trade transactions with foreign countries within a year -Occurs when the total payments received from abroad exceed the total payments made to foreign countries in a year
8.6. Economic growth
8.6.1. The development of economic activities which result in the increae of production of goods and services and social welfare. Economic growth rate = Current real GDP – Previous year real GDP X 100% Previous year real GDP
9. DETERMINANT FACTORS AFFECTING THE AGGREGATE DEMAND CURVE
9.1. Consumption Expenditures (C)
9.1.1. -Connected to households -Factors that influence consumption cause the AD curve to shift either to left or right
9.2. Investment Expenditures (I)
9.2.1. -Incurred by firms -Changes in purchasing capital goods and other investments cause the AD curve move either to the left or to the right
9.3. Goverment Purchases (G)
9.3.1. -Increases its expenses through an expansionary budget policy, the AD curve will shift to the right -If a contractionary budget policy, the AD curve shift to the left
9.4. Net Exports (X-M)
9.4.1. Changes in exports connected to the movements of the AD curve are influenced by factors than price : -Foreign income -Foreign currency exchange rate
9.5. Aggregate Supply
9.5.1. Total of real production of final goods and services available in the country Aggregate supply curve – shows the output quantity that firms are willing to provide at a particular price level - divided into three parts, namely the horizontal, upward and vertical sections

