1. Multiple representations of functions
1.1. Table
1.1.1. When given a table try to find differences to determine which function describes the data
1.1.2. When given a table try to use ordered pairs to look for a pattern
1.2. Graph
1.2.1. When given a graph locate several points and put them in a table
1.2.2. When given a graph use slope , increasing , decreasing or intercepts to write a description
1.3. Equation
1.3.1. When given an equation make a table of values
1.3.2. When given an equation make a graph using the functions or a graphing calculator
1.3.3. Verbal description
1.3.3.1. When given an verbal description make a table by using the pattern described
1.3.3.1.1. When given an verbal description you can draw a graph using hints from the description
2. Piecewise Functions
2.1. A Piecewise function is a function is a combination of one or more functions.
2.1.1. Entertainment Application
2.1.2. Step:1, You must first create a graph because the endpoint of each segment of the graph identity the interval of the domain, use the endpoints and points close to them as the domain values in the table. The domain of the function is divided into three intervals: ages 12 and under: (0,13) , ages 13 and under 55: (13,55), ages 55 and over( 55, infinite). Step:2, Write a verbal description , use the domain intervals and the prices from the table. Movie tickets are $5.00 for children ages 12 and under $9.00 for people ages 13 through 54 and $6.50 for seniors ages 55 and older.
2.2. Graphing Piecewise Functions
2.2.1. f(x)= -4 if x< 2
2.2.2. f(x)=4 if x > 2
2.2.2.1. The Function is composed of two constant pieces that will be represented by horizontal rays. Because the domain is divided at x=2, evaluate both branches of the function at x=2. The function is-4 when x<2, so plot the point (2,-4) with an open circle and draw a horizontal point to the left. The function is 4 when x<2, so plot the point(2,4) with a solid dot and draw a horizontal ray to the light.
3. Comparing Functions
3.1. Minimum and Maximum
3.1.1. Linear functions do not have minimums and maximums, but quadratic functions have absolute minimum and absolute maximums
3.1.1.1. Comparing the Average Rate of Change of Two Functions
3.1.2. When comparing average rate of change you must find the average rate of change for each sets of data ( y1 - y2/ x1-x2= average rate of change) than compare the rates and interpret the data
3.1.2.1. Sketching Graphs Of Functions Given Key Features
3.1.2.1.1. Example : An object is launched from the ground into the air, the graph for the height of the object , h(t), in feet after t seconds passes through the 3 different points . Sketch the graph of the quadratic equation that models the equation. You must find the point that represents the maximum height of the object.
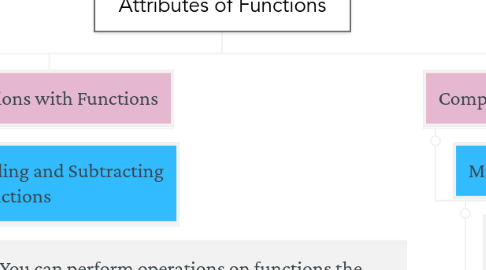
4. Operations with Functions
4.1. Adding and Subtracting Functions
4.1.1. You can perform operations on functions the same way you perform operations on number or expressions. When using addition (f+g)(x)=f(x) =g(x). If you need to subtract a function use (f-g)(x)=f(x)-g(x). Or if you need to use multiplication on a function use (fg)(x)=f(x) x g(x). And finally if you need to use division use (f/g)(x)=f(x)/g(x).

