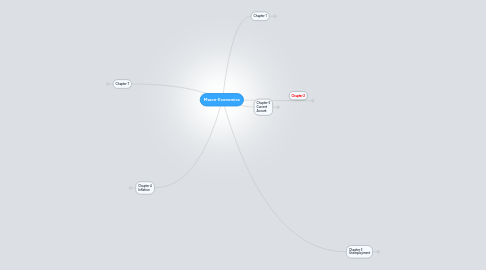
1. Chapter 7
1.1. Consumer
1.1.1. Limited by...
1.1.1.1. Higher Prices
1.1.1.2. Higher taxes
1.1.1.2.1. Less disposable income
1.1.1.3. Higher Unemployment
1.1.1.3.1. Less money
1.1.1.4. Decline in home values
1.1.1.5. Higher Interest Rates
1.1.1.5.1. More incentive to save
1.1.1.6. Low Confidence
1.1.1.7. Works vice versa
1.2. Investment
1.2.1. Limited by...
1.2.1.1. Low consumer spending
1.2.1.1.1. Less profit/ revenue
1.2.1.2. High taxes
1.2.1.3. Increased regulation
1.2.1.4. Less government spending
1.2.1.5. High interest rates
1.2.1.5.1. taking out loans is less appealing
1.2.1.6. works vice versa
1.3. Government Spending
1.3.1. Low confidence in business
1.3.1.1. Government need to make up for lack of spending
1.3.2. lack of investment
1.3.2.1. have to make up for it
1.3.2.1.1. Banks pump in money
1.3.3. Large debt
1.3.4. Works vice versa
1.4. New node
2. Chapter 4 Inflation
2.1. General and Sustained rise in the price level
2.2. Cost Push
2.2.1. Rising cost of production
2.2.1.1. High wages
2.2.1.2. Cost of raw materials (exchange rate)
2.2.1.3. Tax
2.2.2. Solved with
2.2.2.1. Supply Side
2.3. Demand Pull
2.3.1. Aggregate demand exceeding trend growth
2.3.1.1. Firms rise prices to choke demand and increase profit
2.3.2. Solved with
2.3.2.1. Tightening Monetary and Fiscal
2.4. Deflation
2.4.1. General and sustained fall in the price level
2.4.2. Caused by falling AD
2.4.3. Solved with
2.4.3.1. Loosening Monetary and Fiscal policy
3. Chapter 2
3.1. GDP/GNP
3.1.1. GDP=Gross National Product
3.1.1.1. When compared to trend it shows future
3.1.2. GNP= gross national product
3.1.2.1. GNP +NIPFA
3.1.2.1.1. Includes British companies abroad
3.1.3. Real=After inflation is subtracted
3.1.3.1. Nominal=expressed in current price
3.2. Economic Growth
3.2.1. Long term
3.2.1.1. Achieved through the Supply Side
3.2.1.2. Long term = increase in potential level of real out out the economy can produce
3.2.2. Short run = %change in real GDP
3.2.2.1. Achieved by increasing capacity
3.3. Aggregate Supply/Demand
3.3.1. Aggregate Demand
3.3.1.1. Total amount of goods and service demanded in a country at a given price level over a period of time
3.3.1.2. C+I+G+(X-M)
3.3.2. Aggregate Supply
3.3.2.1. Total level of output supplied within an economy at a given price level over a given period
3.4. Index Numbers
3.4.1. Used to compare data that is spread wide by creating an index
3.4.2. (No.in year x/ No. in base year) x100
4. Chapter 1
4.1. Macro Economic Performance
4.1.1. Tries to increase economies level of output.
4.1.1.1. Done via Supply side
4.1.1.1.1. Investment in capital good
4.1.1.1.2. R and D
4.1.1.1.3. Innovation
4.1.1.1.4. Skills, education and training
4.1.1.1.5. Competition (including women)
4.1.1.1.6. Lower income tax
4.1.1.1.7. Immigration
4.1.1.1.8. Population growth
4.1.1.1.9. Reduced Union power
4.1.2. Positive output
4.1.2.1. running above trend
4.1.2.1.1. causes inflation
4.1.3. Negative Output
4.1.3.1. Running below trend
4.1.3.1.1. Causes unemployment
4.1.4. Monetary and Fiscal Policies
4.1.4.1. Try to keep economy as close to trend as possible
4.1.4.1.1. Diagram
4.1.4.2. Fiscal
4.1.4.2.1. Government spending and taxation
4.1.4.3. Monetary
4.1.4.3.1. Central Bank raising or lowering interest
4.1.5. Circular flow of income
4.1.5.1. Shows how money moves in an economy
4.1.5.1.1. diagram
5. Chapter 3 Unemployment
5.1. Someone out of work, in the population of working age and actively seeking a job
5.2. Structural
5.2.1. Decline in industry leading to skill gap
5.2.2. solved with
5.2.2.1. Supply-side
5.2.2.2. promote mobility (stamp duty)
5.3. Cyclical
5.3.1. Low AD
5.3.1.1. less supply needed
5.3.2. Solved with
5.3.2.1. Demand side policies
5.4. Frictional
5.4.1. People between jobs, looking for new jobs
5.4.2. solved with
5.4.2.1. more job info.
5.5. Seasonal
5.5.1. Regular fluctuations in weather or demand
5.5.2. No solution
5.5.2.1. Figures are seasonally adjusted
5.5.3. Classical
5.5.3.1. Firms can not afford labour
5.5.3.2. New node
5.6. Classical
5.6.1. Firms can not afford labour
5.6.2. Solved with
5.6.2.1. reducing minimum wage
6. Chapter 5 Current Acount
6.1. Made up of...
6.1.1. Balance of trade in goods
6.1.2. Balance of trade in services
6.1.3. Net income inflows
6.1.3.1. assets from abroad (inc aid
6.1.4. Net transfers
6.1.4.1. n
6.2. Factors Affecting
6.2.1. Demand Side in short run
6.2.1.1. AD
6.2.2. Supply side
6.2.3. Rate of inflation
6.2.3.1. price of exports higher than others
6.2.4. Non Price factors
6.2.4.1. e.g. after sale service etc.
6.2.5. Exchange Rate
6.2.5.1. Weak Pound
6.2.5.1.1. Exports cheap
6.2.5.1.2. imports expensive
6.2.5.1.3. Shifts AD out
6.2.5.2. strong pound
6.2.5.2.1. exports expensive
6.2.5.2.2. imports cheap
6.2.6. Improvments
6.2.6.1. Expenditure dampening
6.2.6.1.1. reducing AD
6.2.6.2. Expenditure switching
6.2.6.2.1. changing exchange rate
6.2.6.3. Supply Side policies
6.2.6.4. Non price factors
6.2.6.5. Protectionist polices
6.2.6.5.1. e.g. limits and taxes
