
1. Chapter 1: Macroeconomics
1.1. Studies the economy as a whole
1.1.1. New node
1.2. When firms make output scarce resources are used
1.2.1. Labour
1.2.2. Machines
1.2.3. Raw Materials
1.2.4. In a given period, the economy is only able to produce a fixed level of output
1.3. Consumers' demand for goods and services is infinite
1.4. Aim to use resources as effectively as possible
1.4.1. will increase ability to make output over time
1.5. When a firm is growing at trend rate, firms will use resources at normal rates of capacity utilisation
1.5.1. and During a boom
1.5.1.1. firms respond to rising demand by using factors of production very intensively
1.5.1.1.1. Pay workers overtime
1.5.1.1.2. Use more machines to cope with extra ouptut
1.5.1.2. NOT SUSTAINABLE in long-run
1.5.2. Output Gap
1.5.2.1. Recession
1.5.2.1.1. Demand falls
1.5.2.1.2. Firms employ fewer people
1.5.2.1.3. Incomes fall
1.5.2.1.4. Level of Expenditure falls
1.5.2.2. Nagative Output Gap
1.5.2.2.1. Economy has spare capacity
1.5.2.3. Inflation
1.5.2.3.1. General and sustained rise in the Price Level
1.5.2.3.2. Operating at full capacity
1.5.2.3.3. Excess demand
1.5.2.3.4. Firms raise prices to choke demand
1.5.2.3.5. Demand-Pull Inflation
1.5.2.3.6. Wages have upward pressure
2. Chapter 2: Economic Growth
2.1. National Output
2.1.1. National Expenditure =
2.1.1.1. National Income =
2.2. GDP
2.2.1. Value of total production within the domestic economy
2.2.2. Fails to capture any returns from ownership of overseas assets
2.2.2.1. Wealth and Income are different
2.2.2.1.1. Wealth refers to assets
2.2.2.1.2. Income is the return from those assets
2.2.3. Fails to capture any returns foreigners get from owning our assets
2.2.4. GDP per capita= Countries Real GDP per person in $
2.3. GNP = GDP + NPIFA
2.3.1. Gross National Income
2.3.2. Gross Domestic Product
2.3.3. Net Income Property From Abroad
2.4. Real and Nominal Values
2.4.1. Real values are those corrected for the effects of inflation
2.4.2. Nominal values are those expressed in current prices
2.4.2.1. also expressed in 'money terms'
2.4.3. Nominal GDP - Inflation = Real GDP
2.5. Short-Term
2.5.1. Economic Growth is the percentage change in GDP
2.5.2. New node
2.6. Long-Term
2.6.1. Economic Growth is the increase in the potential of Real Output the economy can produce over a given period of time
2.6.2. Economic Growth can only occur if the economy's productive capacity increases
2.6.3. Supply-Side Policies and initiatives will increase long-run growth
2.6.3.1. Increase the quality and quantity of the economy's factors of production
2.6.3.2. improvements in supply-side policies will increase rate of growth and reduce risk of accelerating inflation
2.6.4. Need sufficient demand for the economy to grow
2.7. New node
2.7.1. PL1-PL2: inflation is caused
2.7.2. AD increases, which causes SRAS to also increase
2.7.3. AD = C+I+G+(X-M)
2.7.3.1. Aggregate Demand
2.7.3.2. Consumers
2.7.3.3. Investment
2.7.3.4. Governments
2.7.3.5. Exports
2.7.3.6. Imports
2.8. Index Numbers
2.8.1. used to compare different years and different goods
2.8.2. number of current year/number of base year*100
3. Chapter 3: Unemployment
3.1. Umemployed: if in the population of working age, out of work and actively seeking employment
3.1.1. New node
3.2. Economically Inactive:
3.2.1. In population of working age and not actively seeking unemployment
3.2.2. In education or training
3.2.3. Caring for relatives
3.3. Government uses 2 methods to measure the level of unemployment
3.3.1. Claimant Count
3.3.1.1. Records the number of people who have passed eligibility tests for unemployment and are claiming benefits
3.3.1.2. Claimant count overestimates real value
3.3.1.2.1. Benefit fraud
3.3.1.2.2. People collecting unemployment seeking work
3.3.1.2.3. People moving between jobs may collect benefit
3.3.2. Labour Force Survey
3.3.2.1. Every 3 month, surveys 6,000 households
3.3.2.2. Consistant and makes international comparisons
3.4. Full Unemployment:
3.4.1. When the number of people wishing to work at the market real wage rate equals the number of workers that employers wish to hire at the real wage rate
3.5. Different types of Unemployment:
3.5.1. Cyclical
3.5.1.1. Demand-deficient unemployemnt
3.5.1.2. Occurs when there is a negative output gap (AD is low)
3.5.1.3. Caused by a downturn in the economics cycle
3.5.1.4. Exists when the growth of Aggregate Demand is less than the underlying trend rate of growth of output
3.5.1.5. Low Demand in Economy
3.5.1.6. Workers made redundant
3.5.1.7. Unemployment rises
3.5.1.8. Cyclical unemployment is prevalent during recessions
3.5.1.9. Cyclical Unemployment is involuntary as it is not caused by workers
3.5.2. Structural
3.5.2.1. Occurs when there is a change in the economy's structure
3.5.2.1.1. Creates a mismatch between workers and the skills needed for jobs
3.5.2.2. Tends to be regional
3.5.2.3. Workers inability and reluctance often worsens situation
3.5.2.4. Requires policies and government grants to avoid
3.5.2.4.1. Nissan in Sunderland
3.5.3. Seasonal
3.5.3.1. Results from seasonal fluctuations from weather conditions and demand
3.5.3.1.1. Christmas
3.5.3.1.2. Tourism
3.5.3.2. Particularly common in tourism, agriculture and construction
3.5.4. Frictional
3.5.4.1. Exists when people are moving bewtween jobs
3.5.4.2. There will always be a pool of workers moving between jobs
3.5.4.2.1. No matter how good Aggregate Demand is
3.5.4.3. Voluntary Unemployment
3.5.5. Classical
3.5.5.1. Occurs when real wage is above labour market equilibrium
3.5.5.2. Demand for labour does not equal the supply of labour
3.5.5.3. Caused by a minimum wage or union pressure
3.5.5.3.1. Price workers out of jobs
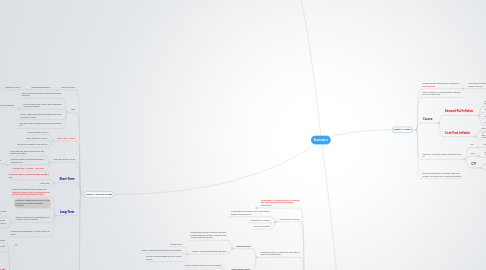
4. Chapter 4: Inflation
4.1. The general and sustained rise in the price level over time
4.1.1. also seen as the devaluing of the purchasing power of money
4.2. Rate of Inflation is the percentage change in prices in a given year
4.3. Causes:
4.3.1. Demand-Pull Inflation
4.3.1.1. Level of Aggregate Demand rises above trend output
4.3.1.2. positive output gap arises
4.3.1.3. firms raise prises
4.3.1.4. Cause of inflation is in demand-side
4.3.2. Cost-Push Inflation
4.3.2.1. Firms experience a rise in costs
4.3.2.2. They pass these increases onto the consumer in the form of higher prices
4.4. Inflation is calculated using 3 methods in the UK:
4.4.1. RPI
4.4.1.1. Retail Price Index
4.4.1.1.1. Used by government to calculate benefit payments
4.4.2. RPIX
4.4.2.1. Retail Price Index excluding mortgage interest payments
4.4.3. CPI
4.4.3.1. Consumer Price Index
4.4.3.2. Official measure of inflation in UK