Unlock the full potential of your projects.
Try MeisterTask for free.
Don't have an account?
Sign Up for Free
Browse
Featured Maps
Categories
Business
Design
Education
Entertainment
Life
Marketing
Productivity
Summaries
Technology
Other
Languages
English
Deutsch
Français
Español
Português
Nederlands
Dansk
Русский
日本語
Italiano
简体中文
한국어
Other
Show full map
Copy and edit map
Copy
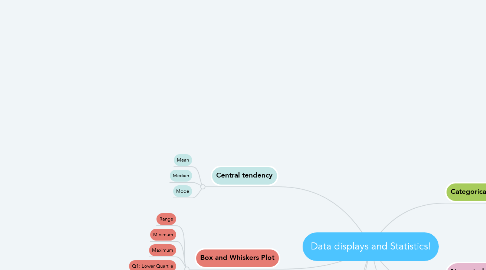
Data displays and Statistics!
Other
natalia macias
Follow
Math 257 Mind Map and data Displays
Get Started.
It's Free
Sign up with Google
or
sign up
with your email address
Similar Mind Maps
Mind Map Outline
Data displays and Statistics!
by
natalia macias
1. Central tendency
1.1. Mean
1.2. Median
1.3. Mode
2. Box and Whiskers Plot
2.1. Range
2.2. Minimum
2.3. Maximum
2.4. Q1: Lower Quartile
2.5. Q2: Median
2.6. Q3: Upper Quartile
3. Scatter plots
3.1. Positive association
3.2. Negative association
3.3. No association
4. Mean Absolute Deviation (MAD)
4.1. Absolute Value
4.2. Absolute Deviation
4.3. Average distance between each data value and the mean.
5. Categorical data!
5.1. Bar Graph
5.2. Pictograph
5.3. Circle graph/Pie chart
6. Numerical data -Discrete and continuous
6.1. Dot plot
6.2. Histogram
6.3. Stem and leaf plot
6.4. Frequency table
7. Line graphs
7.1. Numerical
7.2. Continuous
7.3. Measures data
Get Started. It's free!
Connect with Google
or
Sign Up