

1. DC Output
1.1. Output
1.1.1. KDC
1.1.1.1. ZTL
1.1.1.1.1. TDC
1.2. Cs/day
1.2.1. 1,500
1.2.1.1. 1,300
1.2.1.1.1. 600
1.3. Tons/Yr
1.3.1. 2,139
1.3.1.1. 1,854
1.3.1.1.1. 856
2. Suppliers
2.1. Fazlee-KDC
2.1.1. 35,000 P/day
2.1.1.1. 2,772 tons/Yr
2.2. Packages-LDC
2.2.1. 35,000 P/day
2.2.1.1. 2,772 tons/Yr
2.3. Total Capacity
2.3.1. 70,000 Ps/day
2.3.1.1. 5,545 tons/Yr
3. DC Split
3.1. 2018
3.1.1. KDC
3.1.1.1. ZTL
3.1.1.1.1. TDC
3.1.2. 41%
3.1.2.1. 38%
3.1.2.1.1. 21%
3.2. 2019
3.2.1. 42%
3.2.1.1. 35%
3.2.1.1.1. 23%
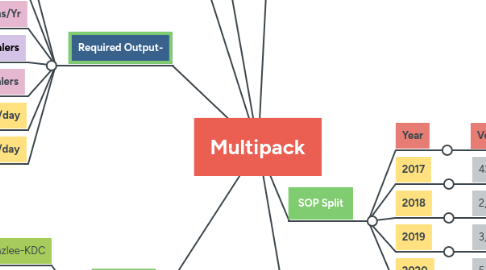
4. Required Output-
4.1. Output
4.1.1. KDC
4.1.1.1. ZTL
4.1.1.1.1. TDC
4.2. Cs/day
4.2.1. 1,505
4.2.1.1. 1,254
4.2.1.1.1. 824
4.3. Tons/Yr
4.3.1. 2,145
4.3.1.1. 1,788
4.3.1.1.1. 1,175
4.4. Current Sealers
4.4.1. 6
4.4.1.1. 8
4.4.1.1.1. 3
4.5. Add Sealers
4.5.1. 1
4.5.1.1. 1
4.5.1.1.1. 2
4.6. Final Cs/day
4.6.1. 1,750
4.6.1.1. 1,500
4.6.1.1.1. 1,000
4.7. Final tons/day
4.7.1. 2,495
4.7.1.1. 2,139
4.7.1.1.1. 1,426
5. Production Child Code at Factory
5.1. Pouch Receiving at Factory
5.2. Movement to DC-Days
5.2.1. KDC
5.2.2. ZTL
5.2.3. TDC
5.3. Contract Creation
5.3.1. 1lac cases. 2 days lag
5.4. Sub-con at DCs
5.4.1. 10,000Cs at a time
5.5. Banding Activity at KDC, ZTL, TDC
5.6. Parent Stock Movement from ZTL
5.6.1. LLM
5.6.2. Lhr
5.6.3. Mul
5.6.4. Fsd
5.6.5. Suk
6. SOP Split
6.1. Year
6.1.1. Vol
6.1.1.1. VG
6.1.1.1.1. DR%
6.2. 2017
6.2.1. 427
6.2.1.1. 158%
6.3. 2018
6.3.1. 2,608
6.3.1.1. 511%
6.3.1.1.1. 89.6%
6.4. 2019
6.4.1. 3,919
6.4.1.1. 50%
6.4.1.1.1. 88.9%
6.5. 2020
6.5.1. 5,109
6.5.1.1. 30%