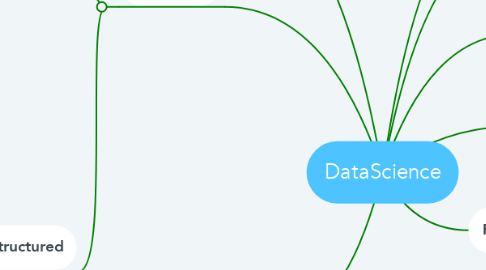
1. 2.Data Collection
1.1. Primary Research
1.1.1. Organizational Documents
1.2. Secondary Research
1.2.1. Search through Internet
1.3. Experimentation / Survey
2. Data Types
2.1. Structured
2.1.1. Numerical
2.1.1.1. Continuous (Qualitative)
2.1.1.1.1. Interval
2.1.1.1.2. Ratio
2.1.1.2. Descrete (Quantitative)
2.1.1.2.1. Count
2.1.1.2.2. cant represented with decimals
2.1.2. Catagorical
2.1.2.1. Binary
2.1.2.1.1. Which have Only two values
2.1.2.1.2. Ex : True or False, Right or Wrong, Default or not, Yes or not etc .
2.1.2.2. > 2 Catagories
2.1.2.2.1. Having more than two values
2.1.2.2.2. Ordinal
2.1.2.2.3. Nominal
2.2. Un Structured
2.2.1. Multimedia files etc which doesn't have any structure .
2.2.2. We need to give a structure to this Data
3. EDA(Exploratory Data Analysis
3.1. 4 - Moments of Business Decisions
3.1.1. 1st Moment
3.1.1.1. Measures of Central Tendencies
3.1.1.1.1. Mean
3.1.1.1.2. Median
3.1.1.1.3. Mode
3.1.2. 2nd Moment
3.1.2.1. Dispersion of Data
3.1.2.1.1. Variance
3.1.2.1.2. Standard deviation
3.1.2.1.3. Range
3.1.3. 3rd Moment
3.1.3.1. Skewness
3.1.3.1.1. Asymmetry in Probability Distribution
3.1.3.1.2. Positive/Right skewed - Longer tale on the right side
3.1.3.1.3. Negative/Left skewed - Longer tale on the left side
3.1.3.1.4. If both tales are equal it will be a normal distribution hence (skewness value = 0)
3.1.4. 4th Moment
3.1.4.1. Kurtosis
3.1.4.1.1. Sharper / Heavier tales - Positive kurtosis
3.1.4.1.2. Broader / Lighter tales - Negative kurtosis
3.2. Graphical Representations
3.2.1. Barplot
3.2.1.1. No business inferences can be drawn
3.2.2. Histogram
3.2.2.1. Shape of Probability Distribution
3.2.2.2. Normal Perfect Bell shaped curve, symmetric on both sides of central tendencies
3.2.3. Boxplot
3.2.3.1. Identify Outliers
3.2.3.2. Lower Extreme - Min value after removing the Outliers.
3.2.3.3. Lower Quartile - Q1
3.2.3.4. Median
3.2.3.5. Upper Quartile - Q3
3.2.3.6. Upper extreme - Max value after removing outliers.
3.2.3.7. (IQR = Q3 - Q1) Middle most 50% of the data
3.2.3.8. Upper Fence = Q3+1.5(IQR)
3.2.3.9. Lower Fence = Q1-1.5(IQR)
3.2.3.10. UF = Q3 + 3(IQR)
3.2.3.11. LF = Q1 - 3(IQR)
4. 1.Business Problem/ Business_Object
5. Project Charter
5.1. High level details of the Project
6. Random Variable
6.1. If Each possible outcome of a variable associated with PB , RV.
6.2. Random variables always represented with 'X' and 'Y'.
7. Probability
8. Probability Distribution
8.1. Plot b/w random variable and its corresponding probabilities
8.2. Continuous PD
8.2.1. Smooth curve
8.3. Discrete PD
8.3.1. Bars
