
Statistics: Basic Concepts
by Cassandra Gonzalez
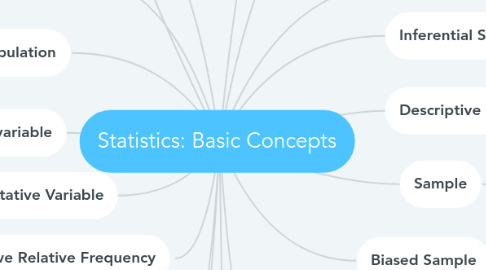
1. Population
1.1. All the organisms of the same group or species, which live in a particular geographical area, and have the capability of interbreeding.
1.1.1. Sample or Census
2. Continuous Variable
2.1. Any number with decimals
2.1.1. Time, Height, Weight
3. Discrete Variable
3.1. All whole numbers
3.1.1. Cars, people, pets
4. Quantitative variable
4.1. Numerical
4.1.1. Number of students in the class
5. Qualitative Variable
5.1. Categorical
5.1.1. Gender of persons
6. Frequency
6.1. The rate at which something occurs or is repeated over a particular period of time or in a given sample.
6.1.1. J
7. Cummulative Relative Frequency
7.1. Accumulation of the previous relative frequencies.
7.1.1. J
8. Frequency table
8.1. Tools used for organizing data
8.1.1. j
9. Histogram
9.1. A diagram consisting of rectangles whose area is proportional to the frequency of a variable and whose width is equal to the class interval.
9.1.1. j
10. Statistics
10.1. Is the science of collecting, organizing and analyzing data, so it can be easily interpreted.
10.1.1. Descriptive or Inferential
11. Inferential Statistics
11.1. Interprets data, uses probability as a tool to make conclusions, decisions or production.
11.1.1. j
12. Descriptive Statistics
12.1. Represents data, organized information in a useful way.
12.1.1. Me: Median, Mo: Mod, Std: Standard deviation
13. Sample
13.1. Subset or a portion of the population
13.1.1. j
14. Biased Sample
14.1. A biased sample is one in which the method used to create the sample results in samples that are systematically different from the population.
14.1.1. Target population: citizens of Chula Vista & Sample: Obtained by randomly polluting people outside.
15. Random Sample
15.1. Random sampling is a procedure for sampling from a population in which the selection of a sample unit is based on chance and every element of the population has a known, non-zero probability of being selected.
15.1.1. jj
16. Absolute
16.1. Not qualified or diminished in any way; total.
17. Relative Frequency
17.1. The number of times that the event occurs during experimental trials, divided by the total number of trials conducted.
17.1.1. J
18. Polygon of Frequency
18.1. Graph constructed by using lines to join the midpoints of each interval, or bin.
18.1.1. J