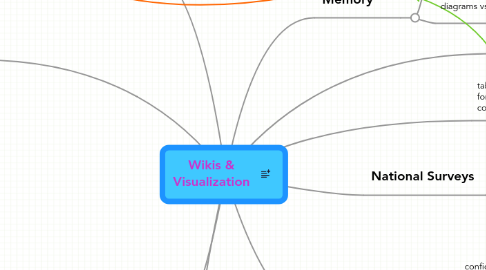
Wikis & Visualization
da Nicola Avery
1. reporting of financial news - comment, opinion, blogs vs newspapers vs both, visualisation of text & visualisation of data - date, time, by whom
2. fff
2.1. general relationship analysis (mapping?)
2.2. economics
2.2.1. prediction & science history...scenarios..
2.2.2. speculation & rumour
2.2.3. fear - markets & individual
2.2.4. trading environment clutter - visual & auditory 'noise'
2.2.5. collaboration vs competition (wiki)
2.2.6. investment banking & financial crisis - other factors e.g universal banking etc
2.2.7. ethics
2.2.8. markets & wider economy
2.2.9. use of technology
3. other wiki format options
4. RSS
5. any psychological factors affecting creator & viewer of data
5.1. use of emotion words & pictures
6. tables, multiple formats, junk compromises,
7. Attention & Memory
7.1. colour & shape
7.2. diagrams vs photos vs 3D vs all 3
8. National Surveys
8.1. what is too much data to represent
8.2. management of conversion of web data already available
8.3. public perception of stats, what is easy to understand
9. Surrey
9.1. confidentiality statements difference between analysis to get detail in first place, then visualisation for a public document
9.2. wiki comments - difference, quick visualisations - wordle vs tag cloud vs word frequency bubbles vs anything else
