1. quality and startegy
1.1. managing quality supports differentiation, low cost and response strategies.
1.2. quality help firms increase sales and reduce cost
2. quality
2.1. the totality of features and characteristics of a product/service that bears on its ability to satisfy stated or implied needs
3. 4 costs of quality
3.1. 1. prevention costs
3.1.1. cost to reduce the potential of defects before its occur. Ex: employees training and quality improvement program.
3.2. 2. appraisal costs
3.2.1. cost to evaluate product or service. Ex: inspection and testing
3.3. 3. internal failure costs
3.3.1. cost result from defective product before delivery been made. Ex: employees producing different product from the actual order.
3.4. 4. external failure cost
3.4.1. cost occur after delivery. Ex: warranty repair and lawsuit from injured customer
4. Total quality management (TQM)
4.1. management system for a customer-focused organization that involves all employees in continual improvement. It uses strategy, data, and effective communications to integrate the quality discipline into the culture and activities of the organization.
5. Inspection
5.1. a part of quality control. performed to detect whether the product meet the certain standard
5.2. when and where
5.2.1. 1. at supplier plan while the supplier is producing
5.2.2. 2. at your facity upon reciept of goods from your supplier
5.2.3. 3. before costly or irreversible processes
5.2.4. 4. during step by step production process
5.2.5. 5. when production is complete
5.2.6. 6. before delivery to customer
5.2.7. 7. at the point of customer contact
5.3. source inspection/source control
5.3.1. poka-yoke
5.3.1.1. a techniques designed to pass only acceptable product
5.3.2. checklist
5.3.2.1. ensure consistency and completeness
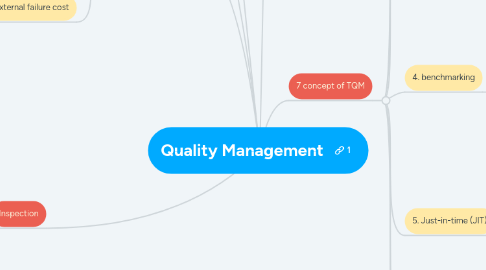
6. 7 concept of TQM
6.1. 1. continuous improvement.
6.1.1. never ending process of continual improvement / zero defect
6.2. 2. six sigma
6.2.1. a program designed to reduce defect, improve customer satisfaction and save costs and time
6.2.2. 1. define the project purpose
6.2.3. 2. measures the process and collect data
6.2.4. 3. analyzes the data ensuring repeatability and reproducibility
6.2.5. 4. improves existing process/procedures
6.2.6. 5. controls the new process to maintain performance levels
6.3. 3. employee empowerment
6.3.1. getting employees involved in product and process improvement.
6.3.2. how?
6.3.2.1. 1. build communication between employees
6.3.2.2. 2. develop supportive supervisors
6.3.2.3. 3. move responsibility to employees
6.3.2.4. 4. bulid high-morale organization
6.3.2.5. 5. create formal team structures
6.4. 4. benchmarking
6.4.1. selecting best practices to use as a standard for performance
6.4.2. steps:
6.4.2.1. 1. determine what to benchmark
6.4.2.2. 2. form a benchmark team
6.4.2.3. 3. identify benchmarking partner
6.4.2.4. 4. collect and analyze benchmarking information
6.4.3. quality circle is a group of employees who meet regularly to solve problems
6.5. 5. Just-in-time (JIT)
6.5.1. system that designed to produce/deliver goods when they are needed
6.5.2. relationship to quality:
6.5.2.1. cut cost of quality
6.5.2.2. improves quality
6.6. 6. Taguchi concepts
6.6.1. engineering and experimental design method to improves product and process design
6.6.2. 1. quality robustness
6.6.2.1. abilty to produce product uniformly in adverse manufacturing and environmental conditions
6.6.3. 2. quality loss function
6.6.3.1. shows that costs increase as the product move away from what the customer wants
6.6.4. 3. target oriented quality
6.7. 7 TQM tools
6.7.1. for generating ideas
6.7.1.1. 1. check sheet
6.7.1.2. 2. Scatter diagram
6.7.1.3. 3. Cause-and-effect diagram
6.7.2. to organize data
6.7.2.1. 1. pareto chart
6.7.2.2. 2. flowchart
6.7.3. to identify problems
6.7.3.1. 1. histogram
6.7.3.2. 2. statistical process control chart
