
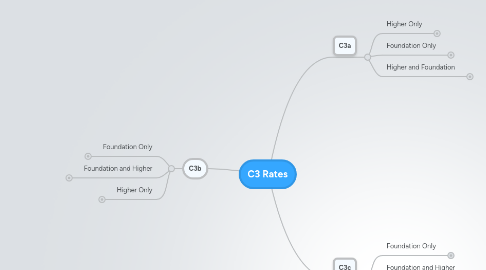
1. C3b
1.1. Foundation Only
1.1.1. Recognise that chemical reaction takes place when particles collide.
1.1.2. Describe the effect of changing temperature on the rate of a chemical reaction.
1.1.3. Describe the effect of changing the concentration on the rate of a chemical reaction.
1.1.4. Describe the effect of changing the pressure on the rate of a chemical reaction of gases.
1.1.5. Interpret data in tabular, graphical and written form about the effect of temperature, concentration and pressure on the rate of reaction for example:
1.1.5.1. • reading off values from a graph
1.1.5.2. • comparing rates of reaction by comparing gradients of graphs
1.1.5.3. • comparing rates of reaction using reaction times.
1.2. Foundation and Higher
1.2.1. Understand that the rate of reaction depends on the number of collisions between reacting particles.
1.2.2. Explain, in terms of the reacting particle model, why changes in temperature change the rate of reaction.
1.2.3. Explain, in terms of the reacting particle model, why changes in concentration change the rate of reaction.
1.2.4. Explain, in terms of the reacting particle model, why changes in pressure change the rate of reaction.
1.2.5. Interpret data in tabular, graphical and written form about the effect of temperature and concentration on the rate of reaction for example:
1.2.5.1. • deciding when a reaction has finished
1.2.5.2. • comparing the rate of reaction during a reaction.
1.2.6. Draw sketch graphs to show the effect of changing temperature, concentration or pressure on:
1.2.6.1. • rate of reaction
1.2.6.2. • amount of product formed in a reaction.
1.3. Higher Only
1.3.1. Understand that the rate of reaction depends on the:
1.3.1.1. • collision frequency of reacting particles
1.3.1.2. • energy transferred during the collision (whether the collision is successful or effective).
1.3.2. Explain, using the reacting particle model, why changes in temperature change the rate of reaction in terms of successful collisions between particles.
1.3.3. Explain, using the reacting particle model, why changes in concentration change the rate of reaction in terms of successful collisions between particles.
1.3.4. Explain, using the reacting particle model, why changes in pressure change the rate of reaction in terms of successful collisions between particles.
1.3.5. Interpret data from tabular, graphical and written form about the effect of temperature and concentration on the rate of reaction for example:
1.3.5.1. • calculating the rate of reaction from the slope of an appropriate graph
1.3.5.2. • extrapolation
1.3.5.3. • interpolation.
2. C3a
2.1. Higher Only
2.1.1. Interpret data from tabular, graphical and written form about the rate of reaction or reaction time for example:
2.1.1.1. • calculating the rate of reaction from the slope of an appropriate graph including determining units
2.1.1.2. • extrapolation
2.1.1.3. • interpolation.
2.1.2. Explain, in terms of reacting particles, why the amount of product formed is directly proportional to the amount of limiting reactant used.
2.2. Foundation Only
2.2.1. Recognise that some reactions can be fast and others very slow:
2.2.1.1. • rusting is a slow reaction
2.2.1.2. • burning and explosions are very fast reactions.
2.2.2. Label the laboratory apparatus needed to measure the rate of reaction producing a gas:
2.2.2.1. • gas syringe
2.2.2.2. • flask.
2.2.3. Interpret data in tabular, graphical and written form about the rate of reaction or reaction time for example:
2.2.3.1. • reading off values from a graph
2.2.3.2. • comparing rates of reaction by comparing gradients of graphs
2.2.3.3. • comparing rates of reaction using reaction times.
2.2.4. Explain why a reaction stops
2.2.5. Plot Graphs
2.2.5.1. Plot experimental results involving gas volumes or mass loss on a graph.
2.2.5.2. Plot experimental results involving reaction times on a graph.
2.3. Higher and Foundation
2.3.1. Understand that the rate of a reaction measures how much product is formed in a fxed time period.
2.3.2. Understand common units for the rate of reaction:
2.3.2.1. • g/s or g/min
2.3.2.2. • cm3/s or cm3/min.
2.3.3. Recognise and use the idea that the amount of product formed is directly proportional to the amount of limiting reactant used.
2.3.4. Recall that the limiting reactant is the reactant not in excess that is all used up at the end of the reaction.
2.3.5. Interpret data in tabular, graphical and written form about the rate of reaction or reaction time for example:
2.3.5.1. • comparing the rate of reaction during a reaction.
3. C3c
3.1. Foundation Only
3.1.1. Recall that the rate of a reaction can be increased by the addition of a catalyst.
3.1.2. Recall that the rate of a reaction can be increased by using powdered reactant rather than a lump (or vice versa).
3.1.3. Describe an explosion as a very fast reaction which releases a large volume of gaseous products.
3.1.4. Interpret data in tabular, graphical and written form about the effect of surface area and the addition of a catalyst on the rate of reaction, for example:
3.1.4.1. • reading off values from a graph
3.1.4.2. • comparing rates of reaction by comparing gradients of graphs
3.1.4.3. • comparing rates of reaction using reaction times.
3.2. Foundation and Higher
3.2.1. Describe a catalyst as a substance which changes the rate of reaction and is unchanged at the end of the reaction.
3.2.2. Understand why only a small amount of a catalyst is needed to catalyse large amounts of reactants and that a catalyst is specific to a particular reaction.
3.2.3. Explain, in terms of reacting particles and surface area, the difference in rate of reaction between a lump and powdered reactant.
3.2.4. Explain the dangers of fine combustible powders in factories (eg custard powder, flour or sulfur).
3.2.5. Interpret data in tabular, graphical and written form about the effect of surface area and the addition of a catalyst on the rate of reaction:
3.2.5.1. • deciding when a reaction has finished
3.2.5.2. • comparing the rate of reaction during a reaction.
3.2.6. Draw sketch graphs to show the effect of changing surface area and the addition of a catalyst on the:
3.2.6.1. • rate of reaction
3.2.6.2. • amount of product formed in a reaction.
3.3. Higher Only
3.3.1. Explain, in terms of collisions between reacting particles, the difference in rate of reaction between a lump and powdered reactant.
3.3.2. Interpret data from tabular, graphical and written form about the effect of surface area and the addition of a catalyst on the rate of reaction:
3.3.2.1. • calculating the rate of reaction from the slope of an appropriate graph
3.3.2.2. • extrapolation
3.3.2.3. • interpolation.