

Aguascalientes
by Laura Aide Hernández Rodríguez
1. Manufacturing industry
1.1. Represent a 20% of gas emissions
2. Example: Metal production, mechanical production, automotive industry, refrigeration industry.
2.1. Casting processes emit the most of greenhouse gases
2.2. Manufacturing processes as automotive or refrigeration emit greenhouse gases in less quantity due to the level of control they have.
3. Farming Industry
3.1. Example:Agricultural industry
3.2. Represent a 10% of air pollution
4. Service industry
4.1. Example: Commerce, financial services, education, health services, public service, utilities, etc.
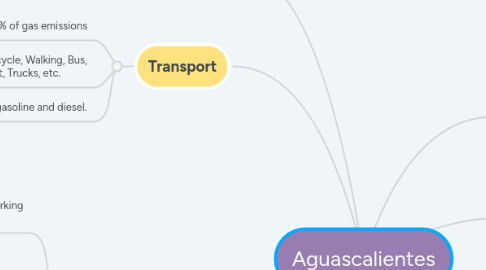
5. Transport
5.1. Represents a 70% of gas emissions
5.2. Types: Car, Taxi, Bicycle, Walking, Bus, Collective transport, Trucks, etc.
5.3. Fuel: petroleum gasoline and diesel.
6. Air Quality control
6.1. There are only 4 control stations working in the state
6.1.1. Center(CEN)
6.1.2. Education institute(IED)
6.1.3. "Secretaría de Medio Ambiente"(SMA)
6.1.4. "Bachillerato Tecnológico Industrial y de Servicios"(CBTIS)