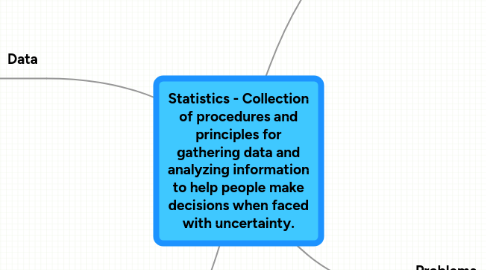
1. Data
1.1. dotplot
1.1.1. a graph in which the results are represented by dots instead of a long list of numbers
1.2. five-number summary
1.2.1. calculates the lowest value, the lower quartile, median, upper quartile, and highest value and gives additional insight into results
1.3. median
1.4. lower quartile
1.5. upper quartile
1.6. interpreting data
1.6.1. margin of error
1.6.1.1. a number added to and subtracted from the sample information to produce an interval that is 95% accurate
1.6.2. statistically significant
1.6.2.1. large enough that it is unlikely to be coincidental
1.6.3. rate
1.6.3.1. base rate
1.6.4. risk
1.6.4.1. baseline risk
1.6.5. practical importance
2. Mistakes
2.1. Unrepresentative Bias
2.1.1. Tells you nothing about population
2.2. Cause-and-effect Conclusions
2.2.1. Can't be made on the basis of an observational study
2.3. Statistically significant finding
2.3.1. Depending on magnitude of relationship, may have no importance
3. Procedures
3.1. population
3.1.1. Collection of all individuals about which information is desired
3.2. random sample
3.2.1. subset of population/everyone has specified probability of selection
3.3. sample survey
3.3.1. info gathered from each included individual
3.4. observational study
3.4.1. participants are merely observed and measured
3.5. variable
3.5.1. characteristic that differs from one individual to the next
3.6. randomized experiment
3.6.1. treatment
3.6.1.1. Specific procedure assigned to participants
3.6.2. random assignment
3.6.2.1. Participant has specified probability of being assigned to treatment
3.6.3. placebo
3.6.3.1. treatment/pill designed to look just like actual treatment.
4. Problems
4.1. nonresponse bias
4.1.1. When people don't respond at all, or only respond to what they want.
4.2. self-selected sample (volunteer sample)
4.2.1. People who respond to Unrepresentative sample
4.3. confounding variable
4.3.1. Not main concern of study but may be partially responsible for results
