
1. Medical and epidemiological evidence
1.1. Bloomberg Stated, that they arent trying to keep people from eating what they want they just want to inform people that it is detrimental to their health (Geller, 2012).
1.2. 2012, over-consumption of SSB and negative health impacts including cancer, heart disease, and obesity (Lustig et al., 2012).
1.2.1. PUBLIC HEALTH ADVOCATES
1.2.1.1. They dismissed what the beverage industry was saying and said it was evidence of cooperating manipulation. The history of the soda cap measure, then, is not just a story of the triumph of business interests, but one of public health’s failure to effectively shape a narrative.
2. Mayoral Task Force
2.1. Drink sizes arose, and prices went up since 1955 which led to excessive calories which led to an obesity factor. They wanted to set a maximum size to reduce excessive consumption of sugary drinks (The New York City Obesity Task Force, 2012).
3. Public Health Advocates
3.1. Health disparities were at stake, similar to the case made for regulating alcohol. Used 'soda cap' to describe the public Health measure.
3.1.1. Epidemiologists and academic leaders, American entertainment celebrities and prominent political leaders including former President Bill Clinton supported the City in arguing that it was essential to curb commercial practices and products that created a toxic environment.
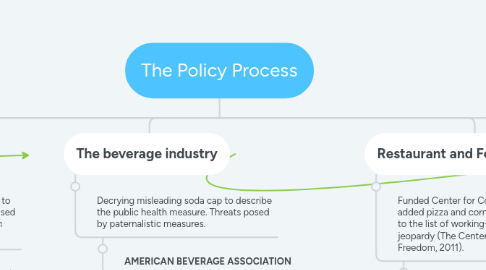
4. The beverage industry
4.1. Decrying misleading soda cap to describe the public health measure. Threats posed by paternalistic measures.
4.1.1. AMERICAN BEVERAGE ASSOCIATION
4.1.1.1. After governor David Paterson proposed an 18 percent sales tax on non-diet sodas the American Beverage Association said "denounced the proposal as ‘a money grab’, while supporters hailed it as akin to the cigarette tax in its potential to reduce the sales of products linked to obesity-related adverse health outcomes (Chan, 2008a; Kristof, 2008).
4.1.1.1.1. which led the battle against soda taxes, portrayed itself as liberty’s champion. A small plane flying over the city pulled a banner that warned, ‘NO DRINK 4 U!’ (Grynbaum, 2012a).
5. Restaurant and Food Industry
5.1. Funded Center for Consumer Freedom added pizza and corned beef sandwiches to the list of working-class favorites in jeopardy (The Center for Consumer Freedom, 2011).
5.1.1. ‘You Are Too Stupid’ campaign against the city’s trans fat ban, City Council members, union workers and industry lobbyists railed at theaters.
6. New York City and State
6.1. From 2008 to 2010, the framework for the dispute over the interpretation of consumer rights in the context of soda was laid when both New York City and State attempted, but failed, to implement one of the most effective tactics for reducing smoking rates: high taxes.
6.1.1. Governor David Paterson
6.1.1.1. proposed an 18 percent sales tax on non-diet sodas and fruit drinks containing less than 70 percent fruit juice as a public health measure (Chan, 2008a).
6.1.1.1.1. QUINNIPIAC UNIVERSITY
7. Bloomberg
7.1. The tax effort failed again in 2010. Given the repeated failures to impose taxes on sodas, Bloomberg sought alternative policies, embracing, in 2012, the idea of a soda cap.
7.1.1. Editorial Board of the New York Times
7.1.1.1. Opposing Bloomberg’s proposal, implicitly drew on the founding history of consumer rights protection. Laws prohibiting the sale of ‘swill milk’, contaminated meat or adulterated drugs stand as landmarks in the history of consumer protection.
7.1.1.1.1. The requirement that chain restaurants post calorie counts was, for the Times, a prime, acceptable example of this second regulatory approach. This, argued the editorial board, was also the approach that was needed for overconsumption of soda. The City’s ‘tough anti-obesity advertising campaigns’, focused on sugary drinks, provided the model to follow (Editorial Board, 2012).