
1. We can also visualise the bias-variance trade-off problem like this
1.1. It's a rookie error to train a model to the point that it's overfit, which means it's great at predicting the outcome with something called the spline fit (the wiggly line)
1.2. In this example, the best fit for the training data (in order to give it the best predictive power for new data) is a quadratic line (the curve)
1.3. The linear fit (straight line) can be said to represent an underfit in this example because the data is too variable to be explained by that line
2. We can imagine an underfit model has a relatively high MSE score; a model with a good balance has a non perfect MSE but reasonably good; and an overfit model reverts to a relatively high MSE score
2.1. Remember that this trend is only highlighted when the model predicts from brand new test data; an overfit model will have a near perfect (i.e. very low) MSE score for the training data
3. The bias variance trade-off is a fundamental concept to understand when working in machine learning
4. Model complexity is known as flexibility
4.1. As we increase a model's flexibility during the training process, there comes a tipping point at which we are just adding "noise"
4.1.1. As model flexibility increases, we see a reduction in the training error, but the tipping point corresponds to an increase in the test data
4.1.1.1. So the "noise" added by increasing a model's flexibility too much during training, results in a model that is worse at making predictions for new data
5. We can say that adding too much flexibility to a model is called overfitting
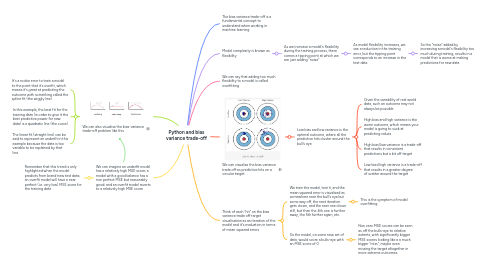
6. We can visualise the bias variance trade off as predictive hits on a circular target
6.1. Low bias and low variance is the optimal outcome, where all the predictive hits cluster around the bull's eye
6.1.1. Given the variability of real world data, such an outcome may not always be possible
6.1.2. High bias and high variance is the worst outcome, which means your model is going to suck at predicting values
6.1.3. High bias/low variance is a trade-off that results in consistent predictions but a bit off target
6.1.4. Low bias/high variance is a trade-off that results in a greater degree of scatter around the target
7. Think of each "hit" on the bias variance trade off target visualisation as an iteration of the model and it's evaluation in terms of mean squared errors
7.1. We train the model, test it, and the mean squared error is visualised as somewhere near the bull's eye but some way off, the next iteration gets closer, and the next one closer still, but then the 4th one is further away, the 5th further again, etc.
7.1.1. This is the symptom of model overfitting
7.2. So the model, on some new set of data, would score a bulls-eye with an MSE score of 0
7.2.1. Non zero MSE scores can be seen as off the bulls-eye to relative extents, with significantly bigger MSE scores looking like a a much bigger "miss", maybe even missing the target altogether in more extreme outcomes