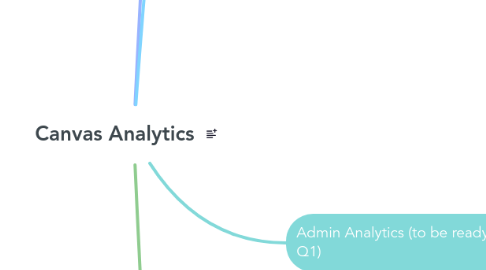
1. New Analytics
1.1. Weekly activities
1.1.1. Page views
1.1.1.1. No. of users who access/view the page
1.1.1.2. No. of participation
1.1.1.2.1. Participations
1.2. Communication per student
1.2.1. Student message/responses
1.2.2. Instructor responses
1.3. Student grades
1.3.1. Quizzes
1.3.1.1. Mean/average
1.3.2. Assignments
1.3.2.1. Mean/average
1.4. Reports
1.4.1. Missing assignments
1.4.2. Late assignments
1.4.3. Excused assignments
1.4.4. Class cluster
1.4.5. Course activity
2. Quiz Statistics
2.1. Student Analysis
2.2. Item Analysis
3. Admin Analytics (to be ready in Q1)
3.1. Overview Dashboard
3.1.1. Course Status
3.1.2. Enrolled Students
3.1.3. Instructor use of Canvas Courses
3.1.4. Courses Status Over Time
3.1.5. Enrolled Students Over Time
3.1.6. Current Course Grade Distribution
3.1.7. Interactions by Category
3.1.8. Interactions Over Time
3.2. Course Dashboard
3.2.1. Courses Published or Concluded with Activity
3.2.2. Courses with an Average Score Below 70%
3.2.3. Courses where 60% of students have no activity
3.2.4. Feature Use in Courses with Activity
3.2.5. Content Feature Use in Courses with Activity Over Time
3.2.6. Activities Feature Use in Courses with Activity Over Time
3.2.7. Courses with Average Scores Below 70
3.2.8. Courses with Low Student Activity
3.3. Student Dashboard
3.3.1. Students that have current course grade
3.3.2. Average Score of Enrolled Students
3.3.3. Students with no activity in past 30 days
3.3.4. Average days since last access
3.3.5. Student Overall Averages
3.3.6. Submissions Breakdown
3.3.7. Student Details
3.3.7.1. Courses Enrolled
3.3.7.2. Submissions on time compared to all
3.3.7.3. Avg Score
3.3.7.4. Courses with Below avg grade
3.3.7.5. Raw Score difference
3.3.7.6. Standardized Score difference
3.3.8. Student Activity Over Time
3.3.9. Student Averages Over Time
4. Suggested Data Analytics
4.1. Participation
4.1.1. Time students spent when accessing pages
4.1.2. Log in time
4.1.3. Time spent on Quizzes
4.1.4. Time spent on Canvas discussions
4.1.5. Access/page views on Canvas discussions
4.2. performance
4.2.1. ungraded exercises
4.2.1.1. The distribution of answer submissions
4.3. Page Views
4.3.1. List of users that have / have not assessed the pages.
4.3.2. Ability to display the item list as it is arranged in Module.
