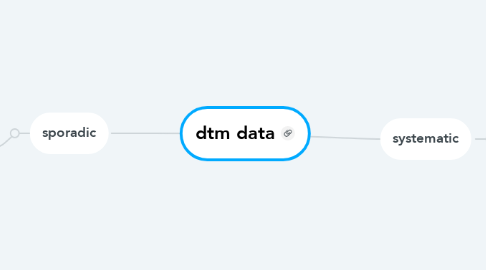
1. sporadic
1.1. PSE
1.1.1. annual
1.1.1.1. 8 indicators
1.1.1.2. BF bcard
1.1.1.2.1. percent of live births occurring at facilities designated as "baby friendly" by the Baby Friendly Hospital Initiative
1.1.1.3. Nat. complete streets
1.1.1.3.1. Nat. complete streets coalition: state has adopted some form of a Complete Streets policy
1.1.1.4. NRC
1.1.1.4.1. state child care regulations align with national standards for serving fruits
1.1.1.4.2. state child care regulation align with national standards for serving vegetables
1.1.1.4.3. state child care regulation align with national standards for moderate- to vigorous-intensity physical activity for preschoolers
1.1.1.4.4. state child care regulation align with national standards for avoiding sugar, including concentrated sweets such as candy, sodas, sweetened drinks, fruit nectars, and flavored milk
1.1.1.4.5. state child care regulations align with national standards for prohibiting use of media and computers with children younger than 2 years
1.1.1.4.6. state child care regulations align with national standards for limiting total media time for children 2 years or older to not more than 30 minutes once a week
1.1.2. biannual
1.1.2.1. mpinc
1.1.2.1.1. average maternity practice in infant nutrition and care (nPINC) score among hospitals and birthing facilities
1.1.3. periodically
1.1.3.1. Profiles
1.1.3.1.1. percent of secondary schools that offered a self-serve salad bar to students
1.1.3.1.2. percent of secondary schools that allowed students to purchase soda pop or fruit drinks from one or more vending machines or at the school store, canteen, or snack bar
1.1.3.1.3. percent of secondary schools that allowed students to purchase sports drinks from one or more vending machines or at the school store, canteen, or snack bar
1.1.3.2. bunch of other data sources
1.1.3.2.1. existence of state-level Food policy Council
1.1.3.2.2. number of farmers markets per 100,000 residents
1.1.3.2.3. number of food hubs in each state
1.1.3.2.4. number of local food policy councils in each state
1.1.3.2.5. percent of farmers markets that accept SNAP benefits
1.1.3.2.6. percent of US population living within 1/2 mile of a park
1.1.3.2.7. percent of youth with parks or playground areas, community centers and sidewalks or walking paths available in their neighborhood
2. systematic
2.1. annual
2.1.1. BRFSS
2.1.1.1. 3 indicators
2.1.1.2. overweight: percent of adults aged 18 years and older who have an overweight classification
2.1.1.3. obesity: percent of adults aged 18 years and older who have obesity
2.1.1.4. physical inactivity: percent of adults who engage in no leisure-time physical activity
2.1.2. NIS
2.1.2.1. 8 indicators
2.1.2.2. percent of breastfed infants who were supplemented with infant formula before 3 months
2.1.2.3. percent of breastfed infants who were supplemented with infant formula before 6 months
2.1.2.4. percent of breastfed infants who were supplemented with infant formula within 2 days of life
2.1.2.5. percent of infants who were breastfed at 12 months
2.1.2.6. percent of infants who were breastfed at 6 months
2.1.2.7. percent of infants who were ever breastfed
2.1.2.8. percent of infants who were exclusively breastfed through 3 months
2.1.2.9. percent of infants who were exclusively breastfed through 6 months
2.1.3. ACS
2.2. periodically
2.2.1. BRFSS rotate module
2.2.1.1. 6 indicators: odd yrs every 4 yrs
2.2.1.2. PA
2.2.1.2.1. 150 aerobic PAG: adults aerobically active 150 minutes
2.2.1.2.2. 300 aerobic PAG: adults aerobically active 300 minutes
2.2.1.2.3. strength PAG: adults meeting muscle strengthening guidelines
2.2.1.2.4. fully met PAG: adults meeting aerobic and muscle strengthening guidelines
2.2.1.3. FV
2.2.1.3.1. Fruit: percent of adults who report consuming fruit less than one time daily
2.2.1.3.2. Veg: percent of adults who report consuming vegetables less than one time daily
2.2.2. annual WIC PC
2.2.2.1. 3 indicators: arrives oct nov
2.2.2.1.1. from USDA
2.2.2.2. overweight: percent of WIC children aged 2 to 4 years who have an overweight classification
2.2.2.3. obesity: percent of WIC children aged 2 to 4 years who have obesity
2.2.2.4. high weight for length: percent of WIC children aged 3-23months old who have a high weight-for-length
2.2.3. YRBS
2.2.3.1. 8 indicators: every odd yr
2.2.3.2. overweight: percent of students in grades 9-12 who have an overweight classification
2.2.3.3. obesity: percent of students in grades 9-12 who have obesity
2.2.3.4. 1 hr physical activity 7 days: adolescent who are physically active daily
2.2.3.5. watching tv a lot: percent of students in grades 9-12 watching 3 or more hours of television each school day
2.2.3.6. daily PE: adolescent who participate in daily physical education
2.2.3.7. FV: percent of students in grades 9-12 who consume fruit less than 1 time daily
2.2.3.8. FV: percent of students in grades 9-12 who consume vegetables less than 1 time daily
