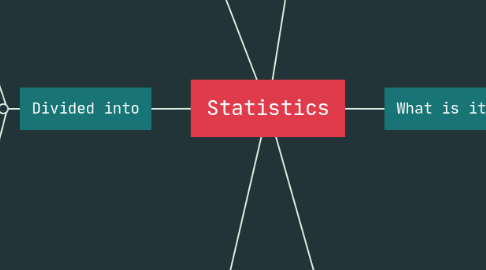
1. Divided into
1.1. Descriptive statistics
1.1.1. Its purpose is to show characteristic aspects of the group (averages, data variability among others), these serve to make comparisons without trying to draw conclusions.
1.1.1.1. Can be done through:
1.1.1.1.1. Graphics
1.1.1.1.2. calculation of averages
1.1.1.1.3. variances of one or more related variables.
1.1.1.1.4. proportions
1.2. inductive statistics
1.2.1. Giving explanations to the behavior of a set of observations, proving the meaning or validity of the results, and trying to discover the root causes, this is highly applicable in sampling, as a result conclusions are obtained that go beyond statistical samples.
2. The take correct decisions in different areas
2.1. As a science it can be used in any field and applied in all disciplines
2.1.1. Provide information about the status of the group.
2.1.2. identify problems
2.1.3. Analyze the changes faced by the group or sample and determine the cause of the behavior
3. Troubleshooting Tools
3.1. Pareto chart
3.1.1. It is used to determine the impact, influence or effect that certain elements have on an aspect.
3.2. Stratification
3.2.1. It is an affinity classification of the elements of a population to analyze them and to be able to more easily determine the causes of the behavior of some quality characteristic.
3.3. Dispersion diagram
3.3.1. It is used to study the possible relationship between one variable and another (bivariate data), it is also used to test possible cause-effect relationships; in this sense it cannot prove that one variable causes the other but it makes it clearer when there is a relationship and the strength of this relationship.
3.4. Cause-effect diagram
3.4.1. It is a systemic tool for solving problems that allows to appreciate the relationship between a quality characteristic (effect) and the factors (causes) that affect it, in order to define the main causes of an existing problem in a process.
3.5. Histogram
3.5.1. Arranges the samples taken from a set in such a way that certain features that are the object of observation are immediately seen to occur frequently.
3.6. Data collection sheet
3.6.1. since it is necessary to constantly check if the requested data has been collected or if certain jobs have been carried out.
3.7. control charts
3.7.1. It is a graphical method that helps to assess whether or not a process is in a state of statistical control. That is, see its behavior within specification limits.
