
1. RANKX
1.1. We can use this function to get rankings for each row in a table argument
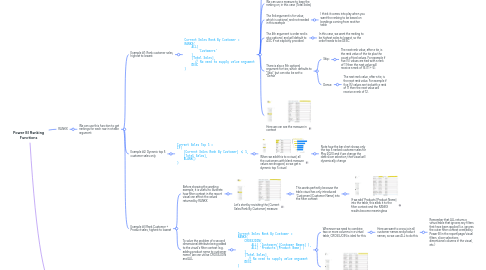
1.1.1. Example #1: Rank customer sales, highest to lowest
1.1.1.1. Current Sales Rank By Customer = RANKX( ALL( 'Customers' ), [Total Sales], , // No need to supply value argument DESC )
1.1.1.1.1. We need to use the ALL table function rather than just the 'Customers' table because RANKX needs to be able to iterate over all customers in our reporting visual
1.1.1.1.2. We can use a measure to base the ranking on, in this case [Total Sales]
1.1.1.1.3. The 3rd argument is for value, which is optional, and not needed in this example
1.1.1.1.4. The 4th argument is order and is also optional, and will default to ASC if not explicitly provided
1.1.1.1.5. There is also a 5th optional argument for ties, which defaults to "Skip", but can also be set to "Dense"
1.1.1.1.6. Here we can see the measure in context
1.1.2. Example #2: Dynamic top 5 customer sales only
1.1.2.1. Current Sales Top 5 = IF( [Current Sales Rank By Customer] <= 5, [Total Sales], BLANK() )
1.1.2.1.1. When we add this to a visual, all the customers with blank measure values are dropped, so we get a dynamic top 5 visual
1.1.3. Example #3 Rank Customer + Product sales, highest to lowest
1.1.3.1. Before showing the working example, it is useful to illustrate how filter context in the report visual can affect the values returned by RANKX
1.1.3.1.1. Let's start by revisiting the [Current Sales Rank By Customer] measure
1.1.3.2. To solve the problem of a second dimensional attribute being added to the visual's filter context (e.g. adding product name to customer name), we can utilise CROSSJOIN and ALL
1.1.3.2.1. Current Sales Rank By Customer = RANKX( CROSSJOIN( ALL( 'Customers'[Customer Names] ), ALL( 'Products'[Product Name] ) ), [Total Sales], , // No need to supply value argument DESC )
2. TOPN
2.1. Unlike RANKX, which returns a scalar value (i.e. 1, 2, 3, etc.), TOPN is a table function (i.e. it returns a virtual tables)
2.2. Imagine we want to calculate the sales for the top 3 selling products
2.2.1. Top 3 Product Sales = CALCULATE( [Total Sales], TOPN( 3, Products, [Total Sales], DESC ) )
2.2.1.1. Here we use TOPN to alter the context of the calculation
2.2.1.1.1. All table functions can be used as filter arguments in CALCULATE
2.2.1.2. The first argument of TOPN is the number of rows we want
2.2.1.3. The second argument of TOPN is the table we want to iterate
2.2.1.3.1. We could also use a table function here, such as VALUES
2.2.1.4. The third argument of TOPN is the expression that will determine the ordering of rows
2.2.1.4.1. In this case, we want total sales by product, and only the top 3 selling products
2.2.1.5. The fourth argument of TOPN is the direction of sequencing
2.2.1.5.1. We choose DESC here so that number 1 is the product total sales with the largest value
2.2.1.6. It's interesting to note that we could also write this measure using SUMX and the result will be the same
2.2.1.6.1. Top 3 Product Sales = SUMX( TOPN( 3, Products, [Total Sales], DESC ), [Total Sales] )
2.2.1.7. Here's measure in reporting context
2.2.1.7.1. Note that this is returning the top 3 product sales per customer, filtered on July 2020 sales only
2.3. For a more advanced example, imagine we want to focus on the top 3 customers by total sales in any context
2.3.1. Top 3 Customer Sales = CALCULATE( [Total Sales], TOPN( 3, ALL( 'Customers'[Customer Names] ), [Total Sales], DESC ), VALUES( 'Customers'[Customer Names] ) )
2.3.1.1. This features a very useful trick: bringing back filter context using VALUES where that filter context was removed by ALL (inside TOPN)
2.3.1.1.1. Without using VALUES as the 2nd filter argument in CALCULATE, we would get the top 3 sales of 3 customers repeating in the table visual for every customer
2.3.1.2. Here's the measure in reporting context
2.3.1.2.1. Here we see only the top 3 customers per total sales per city, filtered to June 2020 sales
2.3.1.2.2. We can add the data bars to the measure via conditional formatting