

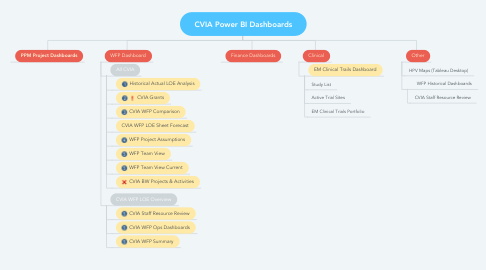
1. PPM Project Dashboards
1.1. CVIA Project Dashboards
1.1.1. Rosters
1.1.2. Objectives
1.1.3. Risks
1.1.4. Issues
1.1.5. Targeted Technologies
2. WFP Dashboard
2.1. All CVIA
2.1.1. Historical Actual LOE Analysis
2.1.1.1. Actual LOE Summary
2.1.1.2. Actual LOE Details
2.1.2. CVIA Grants
2.1.2.1. CVIA Grants
2.1.3. CVIA WFP Comparison
2.1.3.1. WFP Comparison
2.1.3.2. WFP LOE Sheet Not Active
2.1.4. CVIA WFP LOE Sheet Forecast
2.1.4.1. WFP LOE Sheet Forecast
2.1.5. WFP Project Assumptions
2.1.5.1. Assumption Dashboards
2.1.6. WFP Team View
2.1.6.1. Forecast Activities
2.1.6.2. WFP Team Forecast
2.1.7. WFP Team View Current
2.1.7.1. WFP Team Forecast
2.1.8. CVIA BW Projects & Activities
2.1.8.1. CVIA BW Projects & Activities
2.2. CVIA WFP LOE Overview
2.2.1. CVIA Staff Resource Review
2.2.1.1. Staff Resource Review
2.2.1.2. Approved and Forecast
2.2.2. CVIA WFP Ops Dashboards
2.2.2.1. Placesholders
2.2.2.2. MDHT Pooled DB
2.2.2.3. Legal Pooled DB
2.2.2.4. HPP & HPP NCEs
2.2.2.5. PL Forecast DB
2.2.2.6. RTSS Forecast Activities
2.2.3. CVIA WFP Summary
2.2.3.1. Forecast Overview
2.2.3.2. Forecast & Quarter Actuals
2.2.3.3. Forecast Details
2.2.3.4. Forecast Roles
2.2.3.5. Multiple Roles on LOE Sheet
2.2.3.6. No Forecast Details
3. Finance Dashboards
3.1. Summary
3.2. Detailed
3.3. Trend
3.4. Budget
3.5. Mid-level
4. Other
4.1. HPV Maps (Tableau Desktop)
4.2. WFP Historical Dashboards
4.2.1. CVIA Staff Resource Review
5. Clinical
5.1. EM Clinical Trails Dashboard
5.1.1. Study List
5.1.2. Active Trial Sites
5.1.3. EM Clinical Trials Portfolio